stata绘图指令

stata绘图指令 – 潘登同学的stata笔记
文章目录
-
- stata绘图指令 -- 潘登同学的stata笔记
- 绘图概览
-
- 韦恩图
- 折线图
- 连线图
- 线性拟合图
- 直方图
- 函数图
- 添加特殊字符和文字
绘图概览
Stata 提供的图形种类:
- twoway 二维图
- scatter 散点图
- line 折线图
- area 区域图
- lfit 线性拟合图
- qfit 非线性拟合图
- histogram 直方图
- kdensity 密度函数图
- function 函数图
- graph matrix 矩阵图
- graph bar 条形图
- graph dot 点图
- graph box 箱形图
- graph pie 饼图
- ac 相关系数图
- pac 偏相关系数图
- irf 脉冲相应函数图
韦恩图
sysuse nlsw88, clear
pvenn married collgrad south //韦恩图,  R1_regression.do

折线图
sysuse sp500, clear
// 一根折线图
twoway line    high date       // G2_line.do
// 两根折线图
twoway (line high date) (line low date)
twoway line high date || line low date   //等价命令
// 更完整的设定
sysuse sp500, clear
twoway (line high date) (line low date)        ///,                                        ///  title("图1:股票最高价与最低价时序图", box)  /// //图形标题xtitle("交易日期", margin(medsmall))         /// //x轴标题ytitle("股票价格")                           /// //y轴标题ylabel(900(200)1400) ymtick(##5)             /// //y轴刻度标签xlabel(,angle(20))                           /// //x轴刻度标签legend(col(1) ring(0) position(7))           /// //图例note("资料来源:Stata公司,SP500.dta")       ///caption("说明:我做的第一幅Stata图形!")     ///saving(mypig.gph, replace)                       //存储图片graph export G1_mygraph.wmf, replace  //输出为 .wmf 格式
graph export G1_mygraph.png, replace  //输出为 .png 格式

sysuse sp500, clear
twoway line high low date  in 1/20, ///scheme(s1mono)               ///xlabel(,angle(50))           ///ylabel(,angle(0) grid)       /// ymtick(##5)                  /// // ##5表示在每隔5个单位加一条刻度线)lpattern(solid dash)         ///lcolor(green*1.2 black*0.7)  ///lwidth(*1.2 *1.3)
graph export "$path\\myline.png", replace

连线图
sysuse sp500, clear
twoway connect high low date  in 1/20, ///scheme(s1mono)                  ///xlabel(, angle(50))             ///ylabel(, angle(0) grid)         ///lpattern(solid dash)

use "nlswork.dta", clear
gen wage = exp(ln_wage)
replace year = year+1900
bysort collgrad year: egen mwage = mean(wage) //D5_egen.dokeep collgrad year mwage
duplicates drop collgrad year, force  // 删除重复值(为了画图时一一对应)xtset year collgrad
gen diff = D.mwagetwoway  (connect mwage year if collgrad==0)    ///(connect mwage year if collgrad==1)    ///(connect diff  year), ///scheme(s1mono)        ///ytitle("Mean Wage")   ///ylabel(2(1)10, angle(0) grid) ///xlabel(1968(2)1988, grid)     ///legend(label(1 "Non College Graduate") ///label(2 "College Graduate")     ///label(3 "Difference")           ///col(1) ring(0) position(11))

线性拟合图
- lfit:线性拟合
- qfit:非线性拟合
sysuse auto, clear
twoway (scatter price weight) (lfit price weight)

分组线性拟合
sysuse auto, clear
#delimit ; // 用分号代替///的连接作用
sysuse auto, clear ;
twoway (scatter price weight if foreign==1) (lfit price weight if foreign==1)(scatter price weight if foreign==0) (lfit price weight if foreign==0), legend(label(1 "Foreign")label(2 "")label(3 "Demestic")label(4 "")position(4) ring(0));
#delimit cr

使用aaplot标注拟合方程
sysuse auto, clear
gen gpm = 1000/mpg
label var gpm "Gallons per thousand miles"aaplot gpm weightaaplot gpm weight,  ///lopts(lcolor(black*0.8) lpattern(dash)) ///aformat(%04.3f)     ///bformat(%06.4f)     ///rmseformat(%4.3f)   ///scheme(s1mono)

直方图
sysuse nlsw88, clearhistogram age, frequency xlabel(34(1)46)  //频数
histogram age, fraction  xlabel(34(1)46)  //频率
histogram age, percent   xlabel(34(1)46)  //占比=频率*100// 附加正态分布密度曲线
histogram wage, normal
// 附加核密度函数曲线
histogram wage, kdensity


// 长条的显示
histogram wage, gap(50)  // 长条间距缩小为默认值的 50%histogram wage, gap(90) scheme(s1mono)  //黑白图形	  histogram wage, gap(60) scheme(s1mono)  ///fcolor(white) lcolor(black) lwidth(*0.8)

// 附加标签
histogram age, freq  addlabels

分组绘制直方图
sysuse nlsw88, clear
histogram wage, by(collgrad)  ///gap(80) scheme(s1mono) percent

将两个组的直方图绘制在一个图中
sysuse nlsw88,clear
byhist wage, by(collgrad) frac  ///tw(legend(row(2) ring(0) position(1)))

byhist wage, by(collgrad) density ///tw1(color(black)) ///tw2(color(blue)) ///tw(legend(label(1 "Otherwise") ///label(2 "College Graduate") ///col(1) ring(0) pos(1)))

// 核密度函数图
twoway (kdensity wage if collgrad==0)     /// (kdensity wage if collgrad==1),    /// xtitle("Hourly wage")              ///legend(label(1 "Otherwise")        ///label(2 "College Graduate") ///col(1) ring(0) pos(3))

sysuse nlsw88, clearbihist wage, by(collgrad) frac tw(legend(col(1)))

函数图
twoway function y = x, aspect(1) // 横纵比1:1twoway function y = -2*x^2 + 8*x + 10twoway function y = -2*x^2 + 8*x + 10, range(-10 10)twoway function y = -2*x^2 + 8*x + 10, range(-10 10) ///xline(2, lpattern(dash) lcolor(blue))


分布的密度函数
twoway ///(function Normal = normalden(x), range(-8 8)) ///(function t20 = tden(20,x), range(-8 8)) ///(function t3 = tden(3 ,x), range(-8 8)) ///(function t1 = tden(1 ,x), range(-8 8)), ///legend(col(1) position(1) ring(0) size(*1.1)) ///xtitle("t distribution", margin(t+2) size(*1.3))
添加特殊字符和文字
help graph text
// 在图片中添加希腊字母
twoway function y = gammaden(3/2,2,0,x), range(0 10) ///title("{&chi}{sup:2}(3) {bf}distribution")

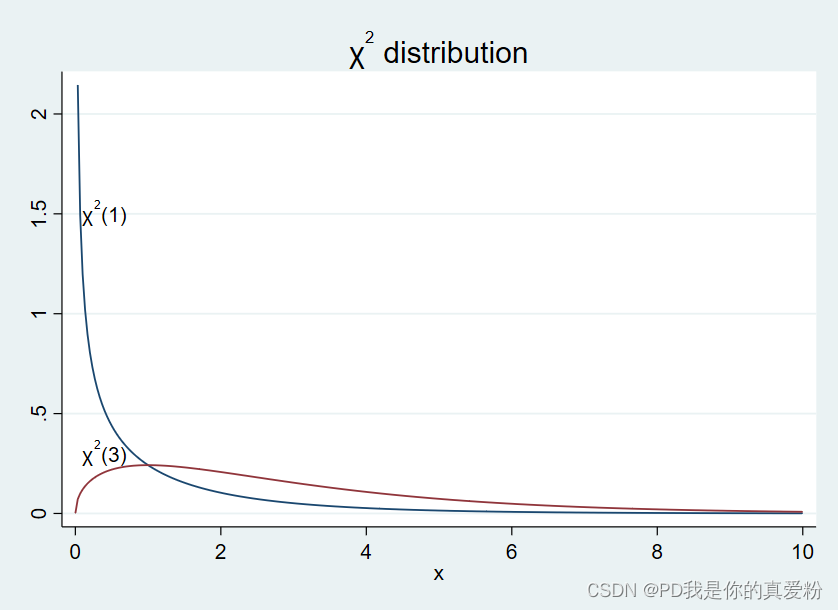
twoway ///(function chi1 = gammaden(1/2,2,0,x), range(0 10)) ///(function chi3 = gammaden(3/2,2,0,x), range(0 10)), ///legend(off) ///subtitle("{&chi}{sup:2} distribution",margin(t+2) size(*1.3)) ///text(1.5 0.4 "{&chi}{sup:2}(1)") ///text(0.3 0.4 "{&chi}{sup:2}(3)")