【mapbox+turf.js】WebGIS空间分析系列(1)

最近在想,自己一直使用webgis做的都是可视化的内容,缺少空间分析的功能。
所以吧,最近理一下使用mapbox + turf来做一些基础的空间分析功能。
大概的思路是,获取目标图层(多个图层),然后选择空间分析的内容,包括缓冲区、叠置、最短路径等。
所以大概的内容就包括了,选择目标对象(点线面),如果是单个图层的话,那就可以直接进行对应的分析;如果涉及多个图层的话,就需要存储两个图层的图像,再进行操作。
—————————————————— 分割线 ——————————————————
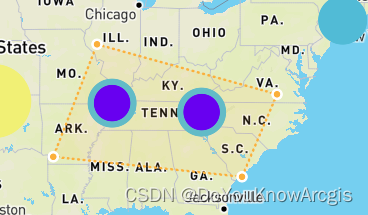
系列的第一篇文章,所展示的功能为:加载了一个默认图层,然后绘制一个多边形,该图层所有的要素在该多边形内都高亮显示。
该功能所使用的库包括了:
mapbox、mapbox-draw、truf、vue3
——————————————————— 教程如下————————————————
STEP 1:创建Vue3项目,以及安装相关的库
npm install mapbox-gl
npm install @mapbox/mapbox-gl-draw
npm install @turf/turf
STEP 2:为了简化程序,所以在默认生成的vue3项目里,将所有代码删除,所有后续的代码将在App.vue里写。
加载相关库。
import mapboxgl from 'mapbox-gl'
import 'mapbox-gl/dist/mapbox-gl.css'
import mapboxdraw from "@mapbox/mapbox-gl-draw"
import "@mapbox/mapbox-gl-draw/dist/mapbox-gl-draw.css"
import * as turf from '@turf/turf'import { onMounted,ref } from 'vue'
创建一个div
<template><div id="map" style="width: 1000px;height: 800px;"></div>
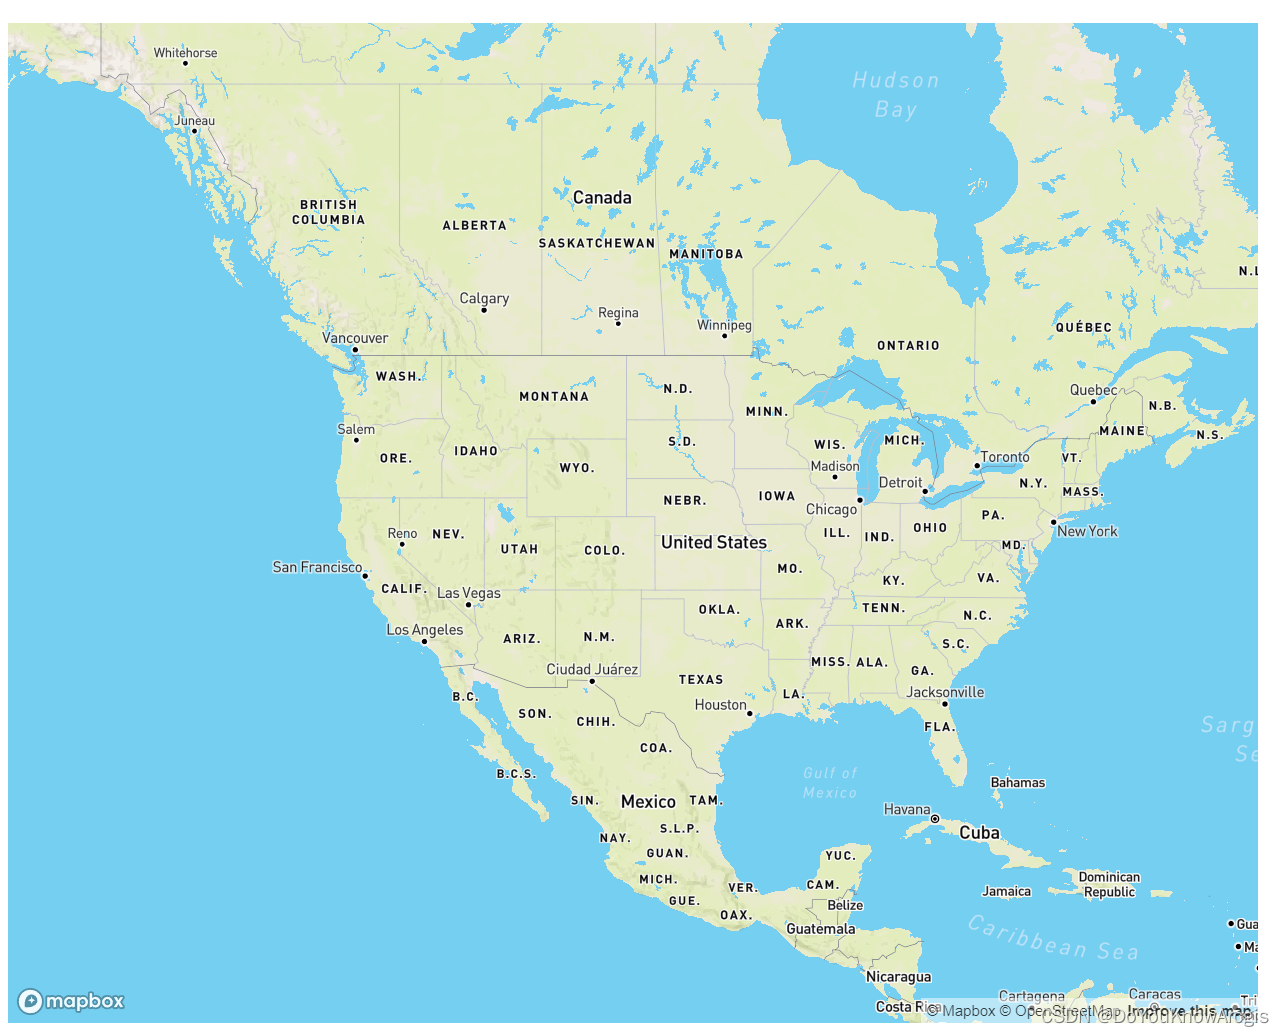
</template>SETP 3:创建mapbox地图对象
mapboxgl.accessToken = 'your-token';
const map = new mapboxgl.Map({container: 'map',style: 'mapbox://styles/mapbox/streets-v11',center: [-103.5917, 40.6699],zoom: 3
});
STEP 4:增加图层(点数据)
这里使用的就是mapbox提供的数据。
map.on('load', () => {map.addSource('earthquakes', {type: 'geojson',data: 'https://docs.mapbox.com/mapbox-gl-js/assets/earthquakes.geojson',cluster: true,clusterMaxZoom: 14, // Max zoom to cluster points onclusterRadius: 50 // Radius of each cluster when clustering points (defaults to 50)});map.addLayer({id: 'clusters',type: 'circle',source: 'earthquakes',filter: ['has', 'point_count'],paint: {'circle-color': ['step',['get', 'point_count'],'#51bbd6',100,'#f1f075',750,'#f28cb1'],'circle-radius': ['step',['get', 'point_count'],20,100,30,750,40]}});})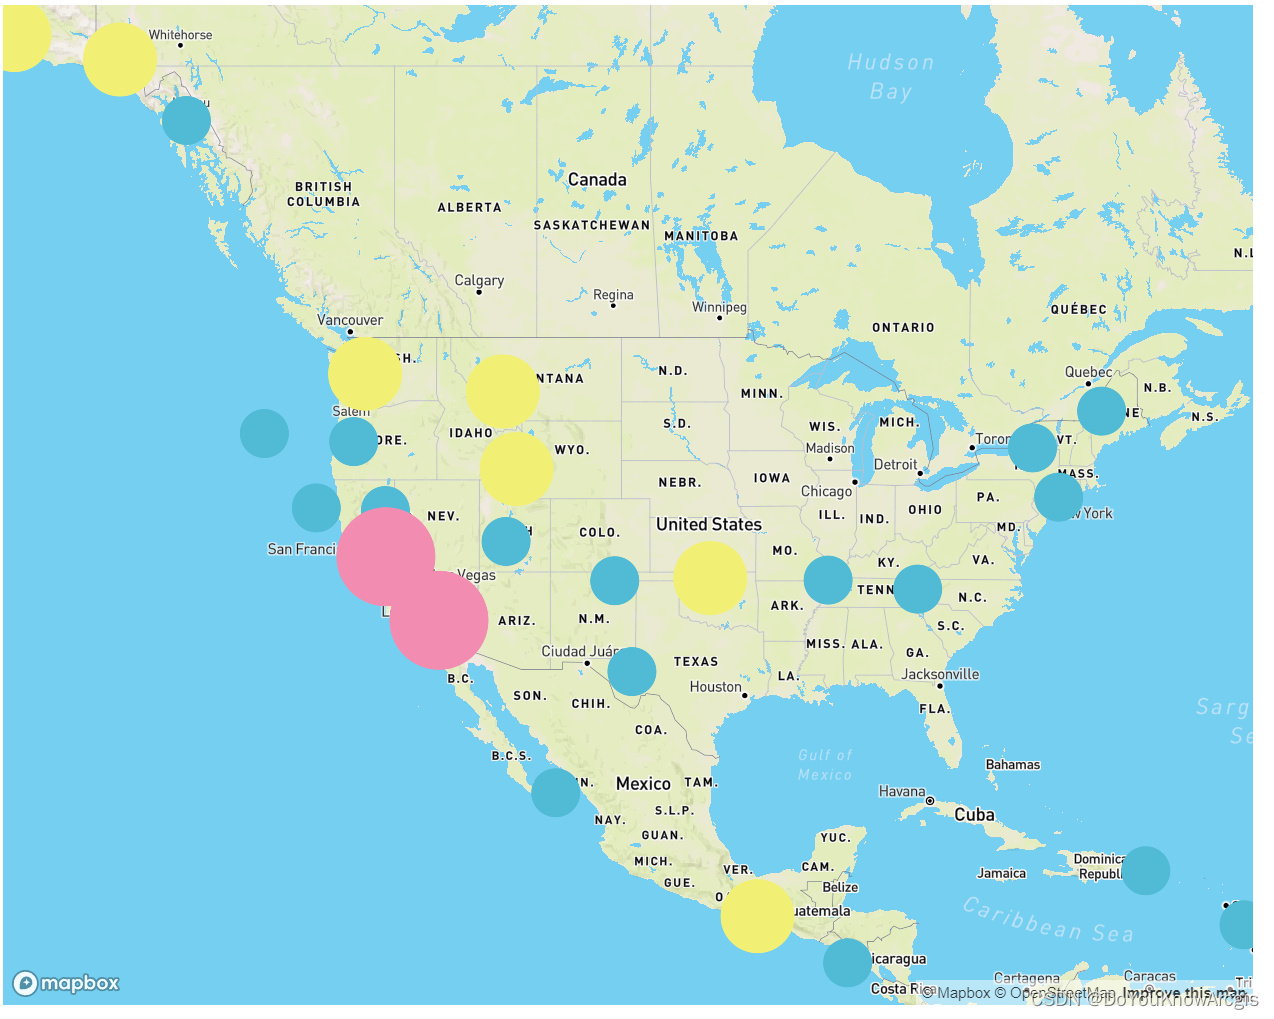
STEP 5:增加绘图插件(mapbox-draw)
// 绘图插件let draw = new mapboxdraw({displayControlsDefault: false,controls: {polygon: true,trash: true}});map.addControl(draw);map.on('draw.create', function (e) {var features = draw.getAll();})map.on('draw.delete', function (e) {map.removeLayer('selected')});
STEP 6:增加功能(框选、目标数据高亮)
在这里,我的思路是,再构建框选区域时,通过turf来计算出在区域内的点(数据),将这些数据构成一个新的图层,置放于最上层,用不同的颜色来表示。
map.on('draw.create', function (e) {var features = draw.getAll();drawCoordinates.value = features.features[0].geometry.coordinatesvar features_Layer = map.queryRenderedFeatures(e.point, {layers: ['clusters']});var selectedFeatures = []drawCoordinates.value.forEach(coordinate => {features_Layer.forEach(feature => {const point = turf.point(feature.geometry.coordinates) // 将要素转为 Turf.js 中的 Point 对象if (turf.booleanPointInPolygon(point, turf.polygon([coordinate]))) { // 判断要素是否在绘制的区域内selectedFeatures.push(feature) // 如果在区域内,则添加到选中要素数组中}})})// 将选中的要素添加到目标数组 便于后续高亮显示const source = {type: 'geojson',data: {type: 'FeatureCollection',features: selectedFeatures}}map.addLayer({id: 'selected',type: 'circle',source: source,paint: {'circle-radius': 15,'circle-color': '#6800F0'}})// console.log(selectedFeatures)})这里样式就随便设置一下了。