Matlab论文插图绘制模板第87期—模值赋色的三维箭头图

在之前的文章中,分享了Matlab三维箭头图的绘制模板:
进一步,如果我们想对每一个箭头赋上颜色,以更加直观地表示其模值的大小,该怎么操作呢?
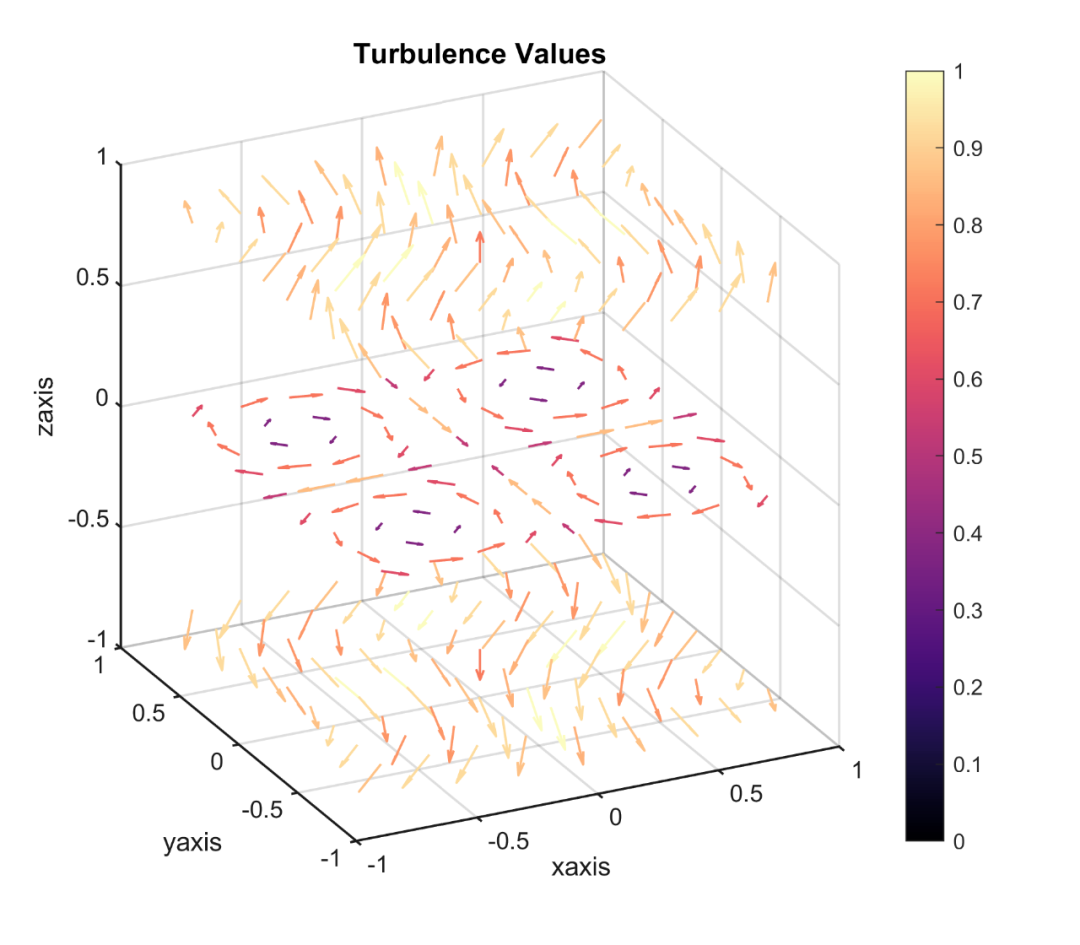
那么,来看一下模值赋色的三维箭头图的绘制模板。
先来看一下成品效果:
特别提示:本期内容『数据+代码』已上传资源群中,加群的朋友请自行下载。有需要的朋友可以关注同名公号【阿昆的科研日常】,后台回复关键词【绘图桶】查看加入方式。
模板中最关键的部分内容:
1. 数据准备
此部分主要是读取原始数据,并初始化绘图参数。
% 读取数据load data.mat% 初始化参数X = x;Y = y;Z = z;U = u;V = v;W = z;
2. 颜色定义
作图不配色就好比做菜不放盐,总让人感觉少些味道。
但颜色搭配比较考验个人审美,需要多加尝试。
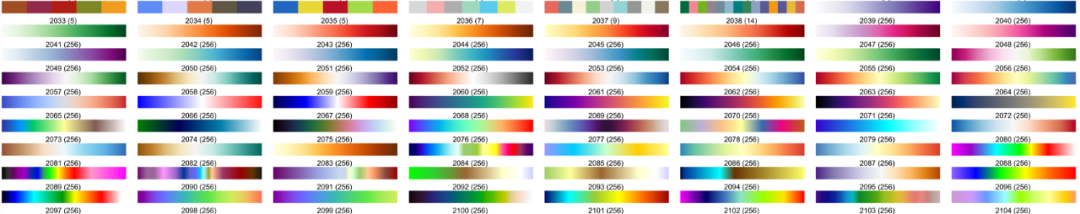
这里直接使用TheColor配色工具中的SCI权威配色库:
%% 颜色定义map = TheColor('sci',2071);% map = flipud(map);
3. 模值赋色的三维箭头图绘制
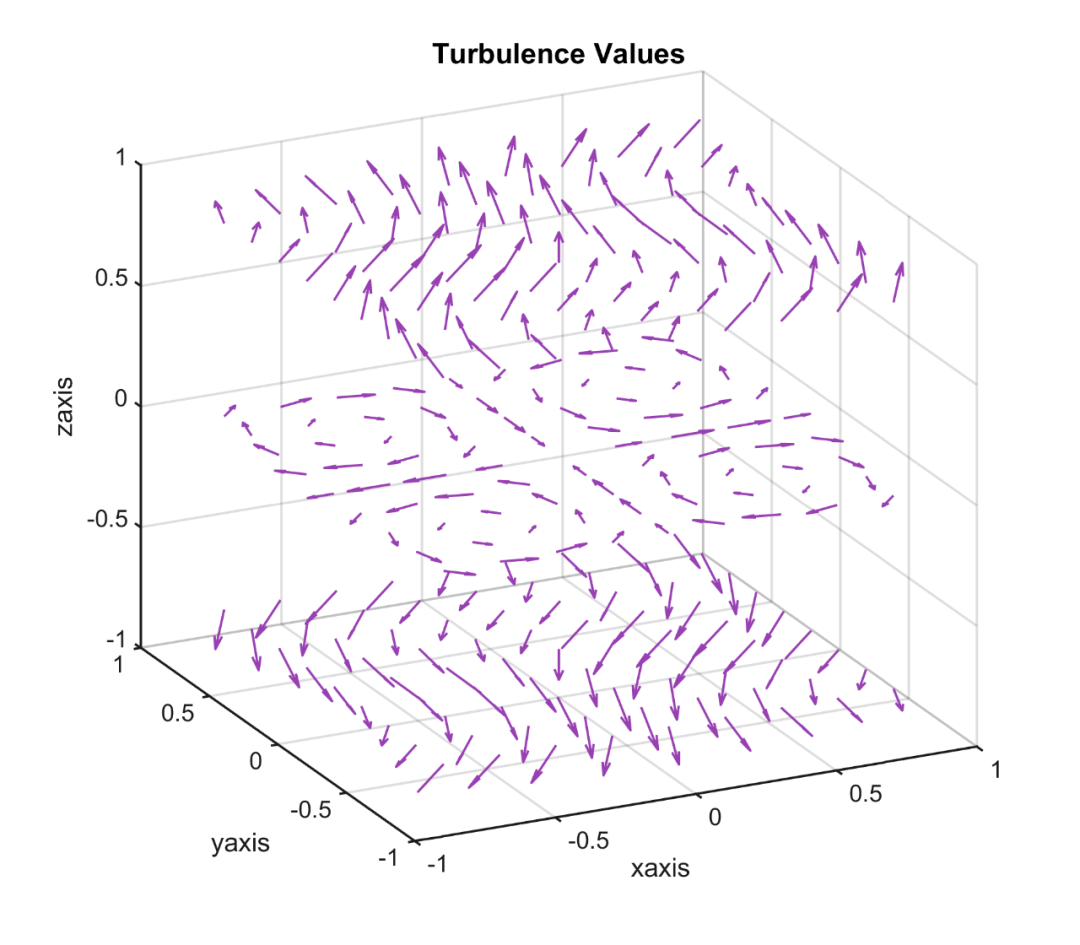
使用‘quiver3’命令,绘制初始三维箭头图。
q = quiver3(X, Y, Z, U, V, W);hTitle = title('Turbulence Values');hXLabel = xlabel('xaxis');hYLabel = ylabel('yaxis');hZLabel = ylabel('zaxis');view(-26,24)
4. 细节优化
利用ColortheArrow函数(Suever),将初始三维箭头图赋上之前选择的颜色并对线型进行调整:
% 赋色ColortheArrow(q,map)colorbar% 线型调整q.LineWidth = 1;q.ShowArrowHead = 'on';
然后,对坐标轴细节等进行美化:
% 坐标区调整set(gca, 'Box','off',... % 边框'LineWidth',1,... % 线宽'XGrid','on','YGrid','on','ZGrid','on',... % 网格'TickDir','out','TickLength',[.01 .01],... % 刻度'XMinorTick','off','YMinorTick','off','ZMinorTick','off', ... % 小刻度'XColor',[.1 .1 .1],'YColor',[.1 .1 .1],'ZColor',[.1 .1 .1]) % 坐标轴颜色% 坐标刻度范围调整axis([-1 1 -1 1 -1 1])% 字体和字号set(gca, 'FontName', 'Arial', 'FontSize', 10)set([hXLabel, hYLabel, hZLabel], 'FontSize', 11, 'FontName', 'Arial')set(hTitle, 'FontSize', 12, 'FontWeight' , 'bold')% 背景颜色set(gcf,'Color',[1 1 1])
设置完毕后,以期刊所需分辨率、格式输出图片。
%% 图片输出figW = figureWidth;figH = figureHeight;set(figureHandle,'PaperUnits',figureUnits);set(figureHandle,'PaperPosition',[0 0 figW figH]);fileout = 'test';print(figureHandle,[fileout,'.png'],'-r300','-dpng');
ColortheArrow函数:
function ColortheArrow(q,map)% author Suever%// Compute the magnitude of the vectorsmags = sqrt(sum(cat(2, q.UData(:), q.VData(:),reshape(q.WData, numel(q.UData), [])).^2, 2));%// Get the current colormapcurrentColormap = colormap(map);%// Now determine the color to make each arrow using a colormap[~, ~, ind] = histcounts(mags, size(currentColormap, 1));% clims = num2cell(get(gca, 'clim'));% [~, ~, ind] = histcounts(mags, linspace(clims{:}, size(currentColormap, 1)));%// Now map this to a colormap to get RGBcmap = uint8(ind2rgb(ind(:), currentColormap) * 255);cmap(:,:,4) = 255;cmap = permute(repmat(cmap, [1 3 1]), [2 1 3]);%// We repeat each color 3 times (using 1:3 below) because each arrow has 3 verticesset(q.Head,'ColorBinding', 'interpolated','ColorData', reshape(cmap(1:3,:,:), [], 4).'); %'%// We repeat each color 2 times (using 1:2 below) because each tail has 2 verticesset(q.Tail,'ColorBinding', 'interpolated','ColorData', reshape(cmap(1:2,:,:), [], 4).');end
以上。