对数据去趋势

对数据去趋势
测量的信号可能显示数据中非固有的整体模式。这些趋势有时会妨碍数据分析,因此必须进行去趋势。
以具有不同趋势的两种心电图 (ECG) 信号为例。ECG 信号对电源干扰等扰动很敏感。加载信号并绘制它们。
load('ecgSignals.mat') t = (1:length(ecgl))';subplot(2,1,1)
plot(t,ecgl), grid
title 'ECG Signals with Trends', ylabel 'Voltage (mV)'subplot(2,1,2)
plot(t,ecgnl), grid
xlabel Sample, ylabel 'Voltage (mV)'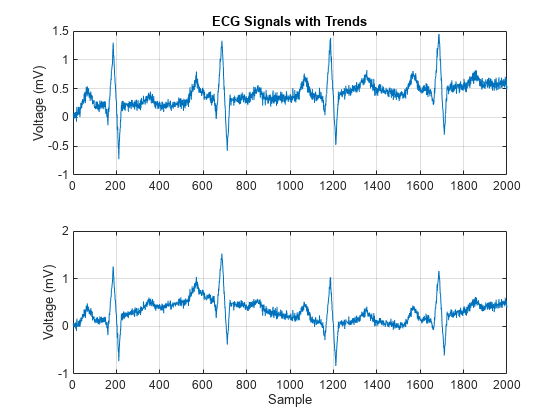
第一个绘图上的信号显示线性趋势。第二个信号的趋势是非线性的。要去线性趋势,请使用 MATLAB® 函数 detrend。
dt_ecgl = detrend(ecgl);要去非线性趋势,请对信号进行低阶多项式拟合并减去它。在本例中,多项式为 6 阶。绘制两个新信号。
opol = 6;
[p,s,mu] = polyfit(t,ecgnl,opol);
f_y = polyval(p,t,[],mu);dt_ecgnl = ecgnl - f_y;subplot(2,1,1)
plot(t,dt_ecgl), grid
title 'Detrended ECG Signals', ylabel 'Voltage (mV)'subplot(2,1,2)
plot(t,dt_ecgnl), grid
xlabel Sample, ylabel 'Voltage (mV)'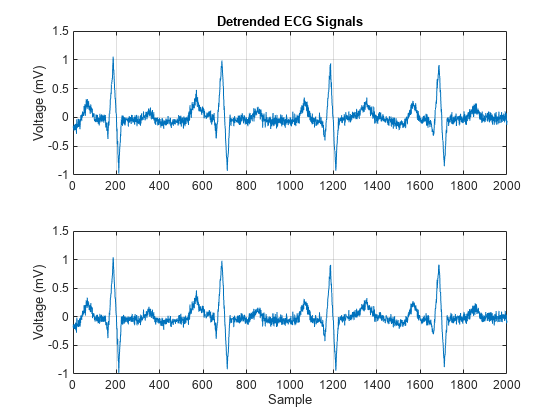
这些趋势已有效地去除。可以看到信号的基线已不再偏移。它们现在可用于进一步处理。
函数detrend
作用:去除多项式趋势
语法
y = detrend(x)
y = detrend(x,n)
y = detrend(x,n,bp)
y = detrend(___,nanflag)
y = detrend(___,Name,Value)
说明
示例
y = detrend(x) 从 x 的数据中去除最佳直线拟合线。
-
如果
x是向量,则detrend从x的元素中减去趋势。 -
如果
x是矩阵,则detrend分别对每列进行运算,从对应的列中减去每个趋势。
示例
y = detrend(x,n) 去除 n 次多项式趋势。例如,当 n = 0 时,detrend 从 x 中删除均值。当 n = 1 时,detrend 去除线性趋势,这等效于上述语法。当 n = 2 时,detrend 去除二次趋势。
示例
y = detrend(x,n,bp) 去除由断点 bp 定义段的连续分段趋势。
y = detrend(___,nanflag) 指定在使用上述任一语法时如何处理 NaN 值。例如,detrend(x,'omitnan') 在计算趋势之前删除 NaN 值,而 detrend(x,'includenan') 包括这些值(默认)。
示例
y = detrend(___,Name,Value) 使用一个或多个名称-值对组指定其他参数。例如,detrend(x,1,bp,'Continuous',false) 指定拟合趋势可以有不连续趋势。
示例
连续线性趋势
创建一个数据向量,并去除连续线性趋势。绘制原始数据、去趋势后的数据和线性趋势。
t = 0:20;
x = 3*sin(t) + t;
y = detrend(x);
plot(t,x,t,y,t,x-y,':k')
legend('Input Data','Detrended Data','Trend','Location','northwest')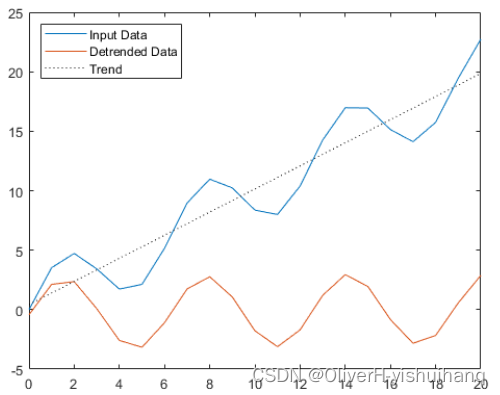
连续二次趋势
创建一个数据向量,并去除连续二次趋势。绘制原始数据、去趋势后的数据和趋势。
t = 0:20;
x = 20*sin(t) + t.^2;
y = detrend(x,2);
plot(t,x,t,y,t,x-y,':k')
legend('Input Data','Detrended Data','Trend','Location','northwest') 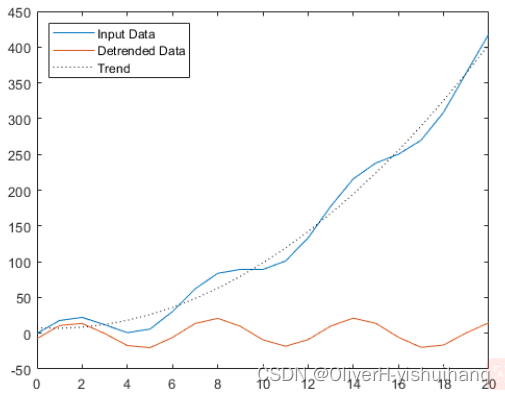
不连续线性趋势
创建一个数据向量,并使用 0 处的断点去除分段线性趋势。指定所得到的输出可以是不连续的。绘制原始数据、去趋势后的数据和趋势。
t = -10:10;
x = t.^3 + 6*t.^2 + 4*t + 3;
bp = 0;
y = detrend(x,1,bp,'SamplePoints',t,'Continuous',false);
plot(t,x,t,y,t,x-y,':k')
legend('Input Data','Detrended Data','Trend','Location','northwest') 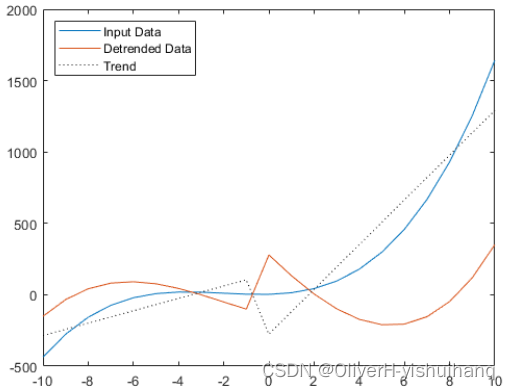
输入参数
x - 输入数组
向量 | 矩阵 | 多维数组
输入数组,指定为向量、矩阵或多维数组。当 x 是多维数组时,detrend 将在所有维度上逐列进行操作。
数据类型: double | single
复数支持: 是
n - 多项式次数
非负整数标量 | 'constant' | 'linear'
多项式次数,指定为非负整数标量,或指定为 'constant'(等效于 0)或 'linear'(等效于 1)。
bp - 断点
向量
用于定义数据的分段的断点,指定为包含以下项之一的向量:
-
指示断点位置的样本点值。样本点值包含在默认样本点向量
[1 2 3 ...]或'SamplePoints'参数指定的向量中。 -
逻辑值,其中逻辑值 1 (
true) 表示输入数据的对应元素中的一个断点。如果bp包含逻辑值,则其长度必须与样本点相同。
当您要计算不同数据段的单独趋势时,断点非常有用。
数据类型: double | single | datetime | duration | logical
nanflag - NaN 条件
'includenan' (默认) | 'omitnan'
NaN 条件,指定为下列值之一:
-
'includenan'- 在计算趋势时,在输入数据中包含NaN值。 -
'omitnan'- 在计算趋势时忽略输入中的所有NaN值。
名称-值参数
示例: y = detrend(x,'SamplePoints',1:10:1000)
指定可选的、以逗号分隔的 Name,Value 对组参数。Name 为参数名称,Value 为对应的值。Name 必须放在引号中。您可采用任意顺序指定多个名称-值对组参数,如 Name1,Value1,...,NameN,ValueN 所示。
Continuous - 连续性约束
true (默认) | false
连续性约束,指定为以逗号分隔的对组,该对组由 'Continuous' 和下列值之一组成:
-
true- 拟合趋势在任何位置都必须是连续的。 -
false- 拟合趋势可以包含不连续趋势。
SamplePoints - 样本点
[1 2 3 ...] (默认) | 向量
样本点,指定为逗号分隔的对组,其中包含 'SamplePoints' 和一个向量。样本点代表输入数据在 x 轴上的位置,它们必须唯一并经过排序。
数据类型: double | single | datetime | duration