prometheus监控之pushgateway

prometheus监控之pushgateway
文章目录
pushgateway是什么
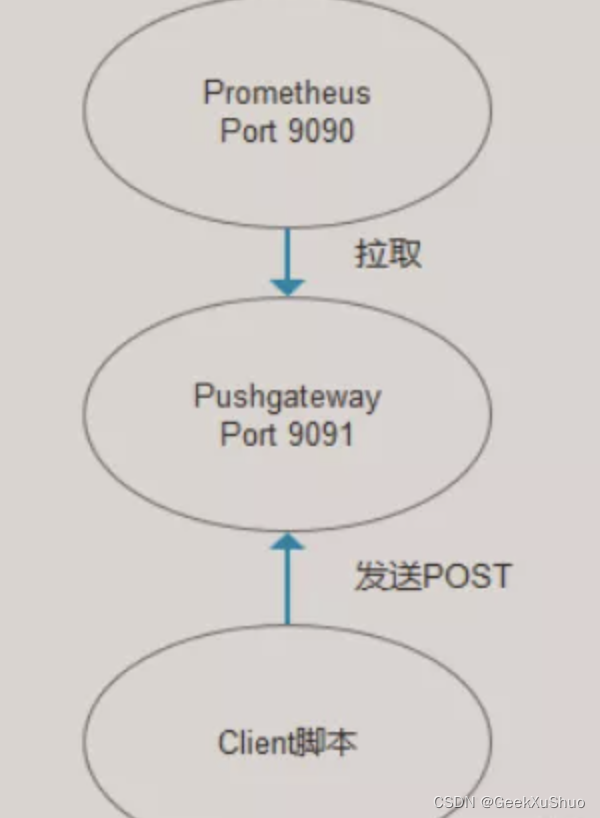
pushgateway是另一种数据采集的方式,采用被动推送来获取监控数据的prometheus插件,它可以单独运行在任何节点上,并不一定要运行在被监控的客户端。
首先通过用户自定义编写的脚本把需要监控的数据发送给pushgateway,
pushgateway再将数据推送给对应的Prometheus服务。
对于短时运行、不支持轮询的任务,可以引入 pushgateway,将指标数值以 push 的方式推送到 pushgateway暂存,然后 prometheus 从 pushgateway 中轮询
pushgateway是Prometheus下的一个组件,用来当做采集对象和Prometheus的代理,Prometheus会定时的从gateway上面pull数据。
pushgateway使用场景
Prometheus 采用 pull 模式,可能由于不在一个子网或者防火墙,导致 Prometheus 无法直接拉取各个 target 数据。Prometheus 在一些情况下无法直接拉取各个 target 数据
在监控业务数据的时候,需要将不同数据汇总, 由 Prometheus 统一收集。
架构图

安装pushgateway
1、下载
wget https://github.com/prometheus/pushgateway/releases/
tar -zxvf pushgateway-1.2.0.linux-amd64.tar.gz
cp -r pushgateway-1.2.0.linux-amd64 /usr/local/pushgateway2、编写systemd管理文件
vi /usr/lib/systemd/system/pushgateway.service
[Unit]
Descriptinotallow=Prometheus Pushgateway daemon
After=network.target
[Service]
Type=simple
User=root
Group=root
ExecStart=/usr/local/pushgateway/pushgateway \\--persistence.file=/usr/local/pushgateway/pushgateway_persist_file \\--persistence.interval=5m \\--web.listen-address=:9091
Restart=on-failure
[Install]
WantedBy=multi-user.target
配置说明
-
–persistence.file=/usr/local/pushgateway/pushgateway_persist_file:指定持久化文件路径或名称。如果没有指定存储,则监控指标仅保存在内存中,若出现pushgateway重启或意外故障,便会导致数据丢失。默认情况下,持久化文件每5分钟写一次,可以使用
-
–persistence.interval:重新设置写入文件的时间间隔。
-
–web.listen-address=:9091,进行端口设置。
3、重新加载system并启动pushgateway
systemctl daemon-reload
systemctl restart pushgateway
systemctl status pushgateway4、访问
http://localhost:9091
prometheus配置
- job_name: pushgetway honor_labels: truehonor_timestamps: truescrape_interval: 15sscrape_timeout: 10smetrics_path: /metricsscheme: httpstatic_configs:- targets:- 127.0.0.1:9091labels:instance: pushgateway
因为Prometheus配置pushgateway的时候,指定job和instance,但是它只表示pushgateway实例,不能真正表达收集数据的含义。所以在prometheus中配置pushgateway的时候,需要添加honor_labels: true参数,从而避免收集数据被push本身的job和instance被覆盖。不加
honor_labels: true,会取gateway的job和instance,设置了的话会取push过来的数据,job必填,instance没有就为""空字符串
pushgateway的使用
数据推送默认格式
http://<ip>:9091/metrics/job/<JOBNAME>{/<LABEL_NAME>/<LABEL_VALUE>}
- job 标签值,后边可以跟任意数量的标签对(必填项)
- <LABEL_NAME>/<LABEL_VALUE>:可选项 来区分各个指标
入门操作
echo "test_metric 123456" | curl --data-binary @- http://localhost:9091/metrics/job/test_job
刷新Pushgateway界面,查看界面
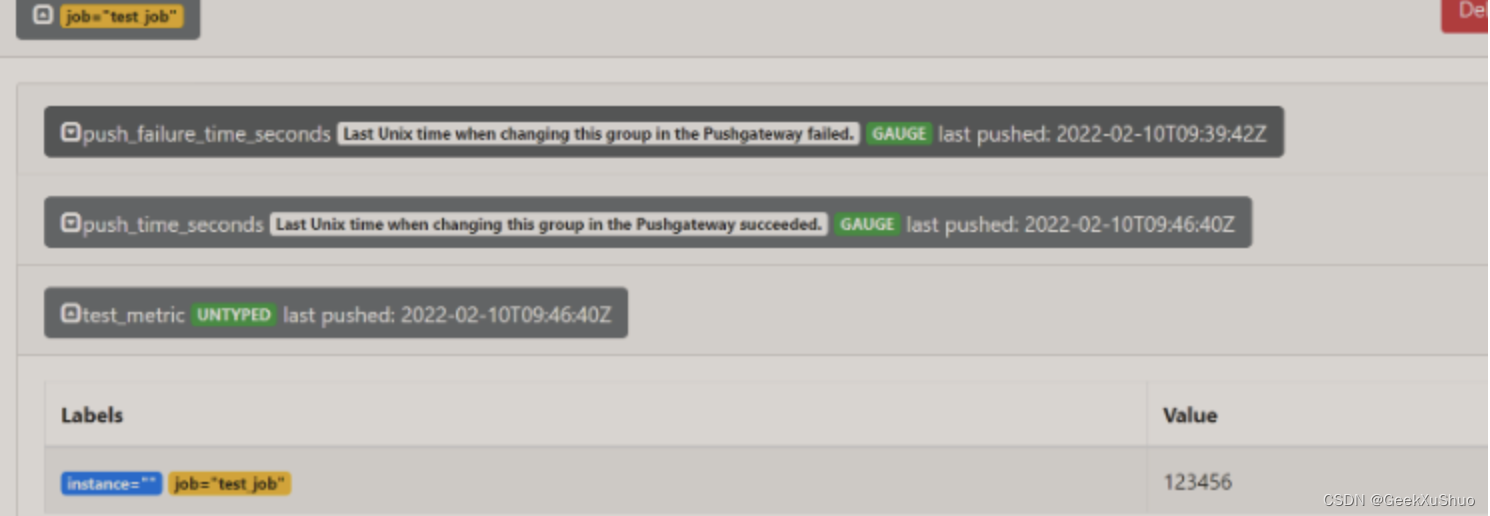
上图中,除了 test_metric 外,同时还新增了 push_time_seconds 和 push_failure_time_seconds 两个指标,这两个是 PushGateway 系统自动生成的相关指标。
在 Prometheus UI 页面上 Graph 页面可以查询的到该指标了。
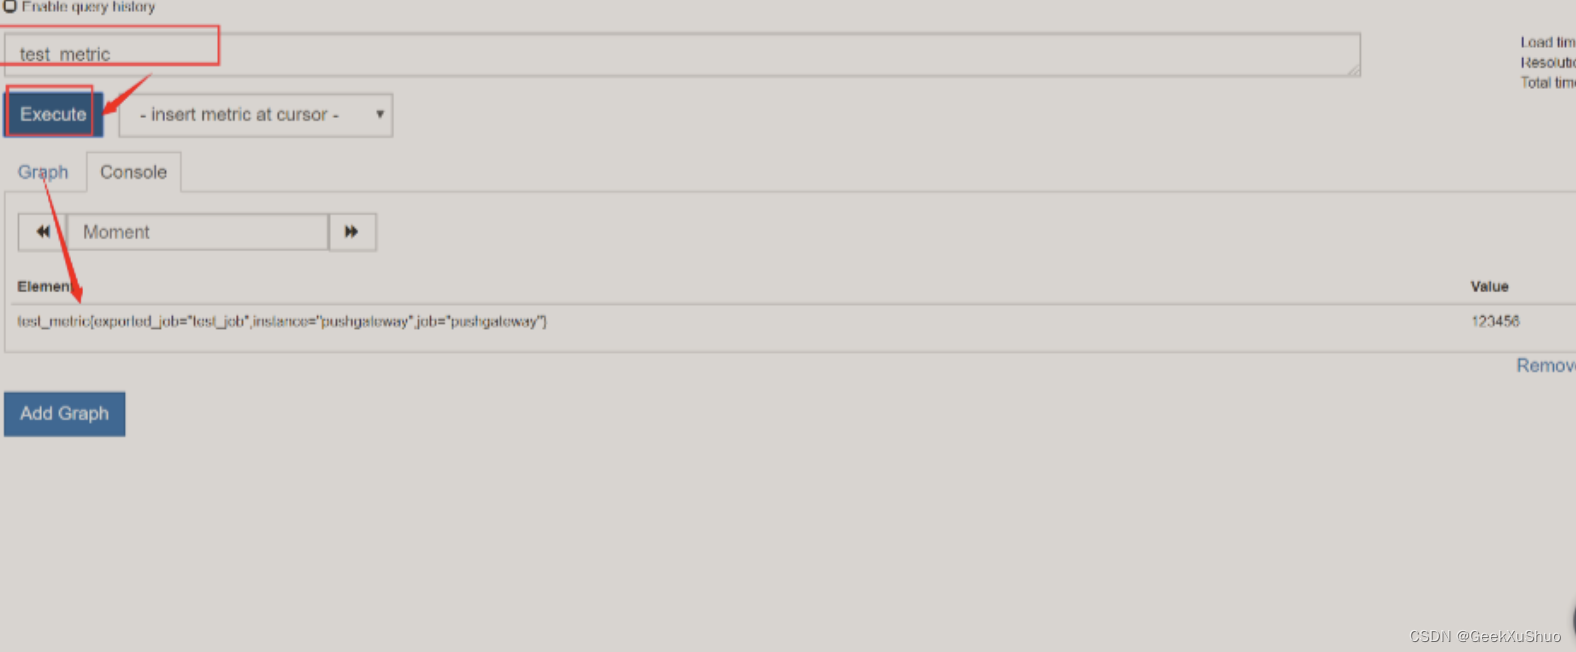
test_metric 我们查询出来的结果为
test_metric{exported_job="test_job",instance="pushgateway",job="pushgateway"}
注意:如果发现,指标所属 job 名称为 test_job ,显示的为 exported_job=“test_job” ,而 job 显示为 job=“pushgateway”
为了避免这种情况的发送,需要在Prometheus的配置文件中增加增加 honor_labels: true 参数配置
较为复杂数据的推送
一次性推送多个指标(命令行方式)
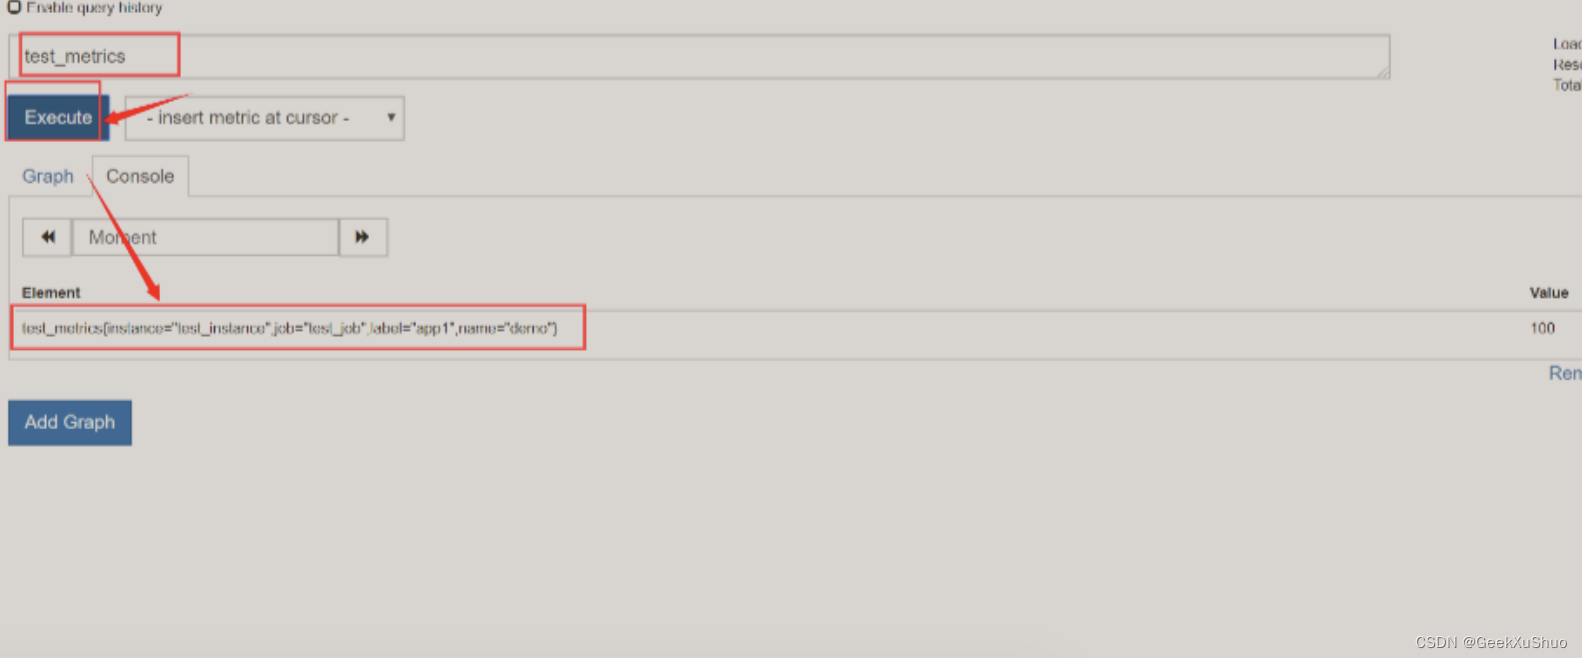
cat <<EOF | curl --data-binary @- http://localhost:9091/metrics/job/test_job/instance/test_instance
# TYPE test_metrics counter
test_metrics{label="app1",name="demo"} 100.00
# TYPE another_test_metrics gauge
# HELP another_test_metrics Just an example.
another_test_metrics 123.45
EOF
/metrics/job/test_job 和 metrics/job/test_job/instance/test_instance ,它们都属于 test_job,但是它们属于两个指标值,因为 instance 对二者做了区分
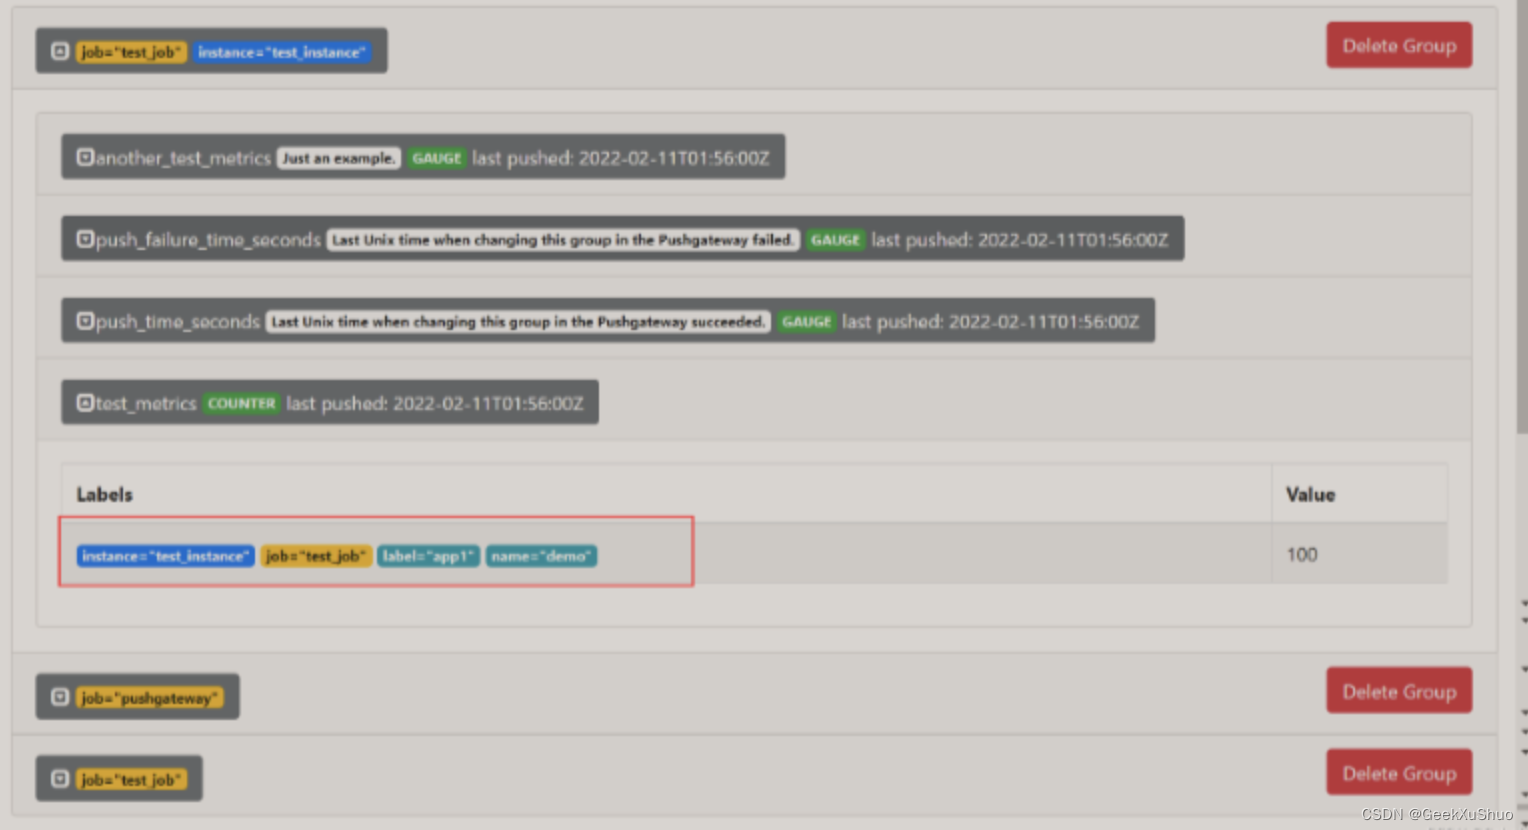
instance="test_instance"属于job=“test_job”, 而label=“app1”,name=“demo” 属于instance="test_instance"的数据
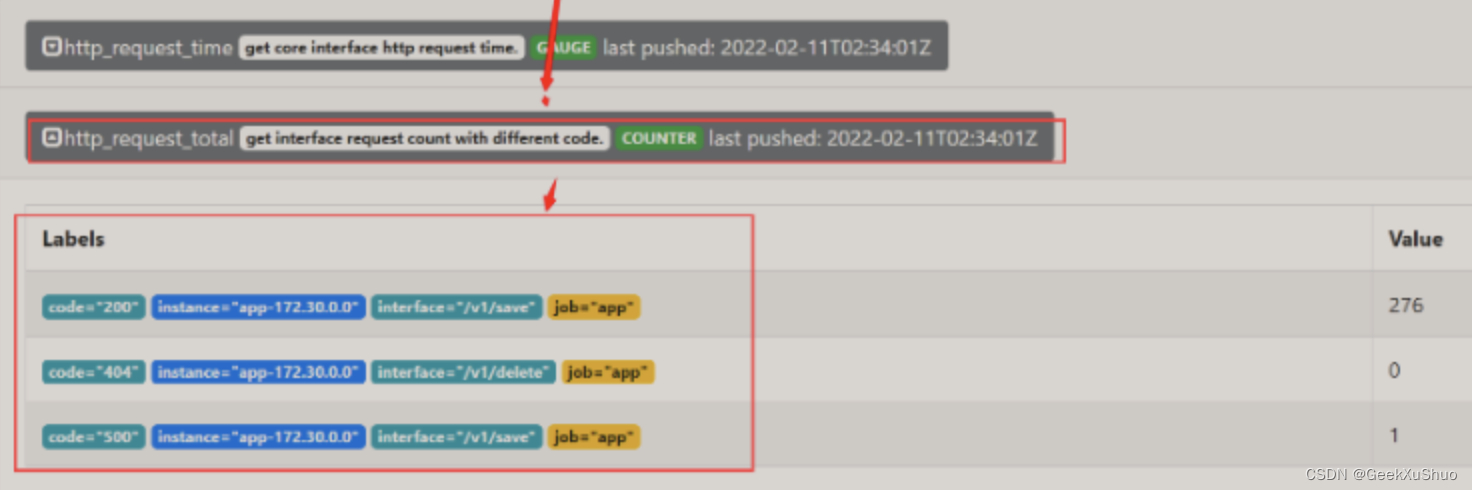
一次性推送多条数据(文本方式)
编写指标数据文件
[root@localhost data]# vim pgdata.txt
# TYPE http_request_total counter
# HELP http_request_total get interface request count with different code.
http_request_total{code="200",interface="/v1/save"} 276
http_request_total{code="404",interface="/v1/delete"} 0
http_request_total{code="500",interface="/v1/save"} 1
# TYPE http_request_time gauge
# HELP http_request_time get core interface http request time.
http_request_time{code="200",interface="/v1/core"} 0.122[root@localhost data]# curl -XPOST --data-binary @pgdata.txt http://localhost:9091/metrics/job/app/instance/app-172.30.0.0
删除某一个指标
通过ui界面进行删除
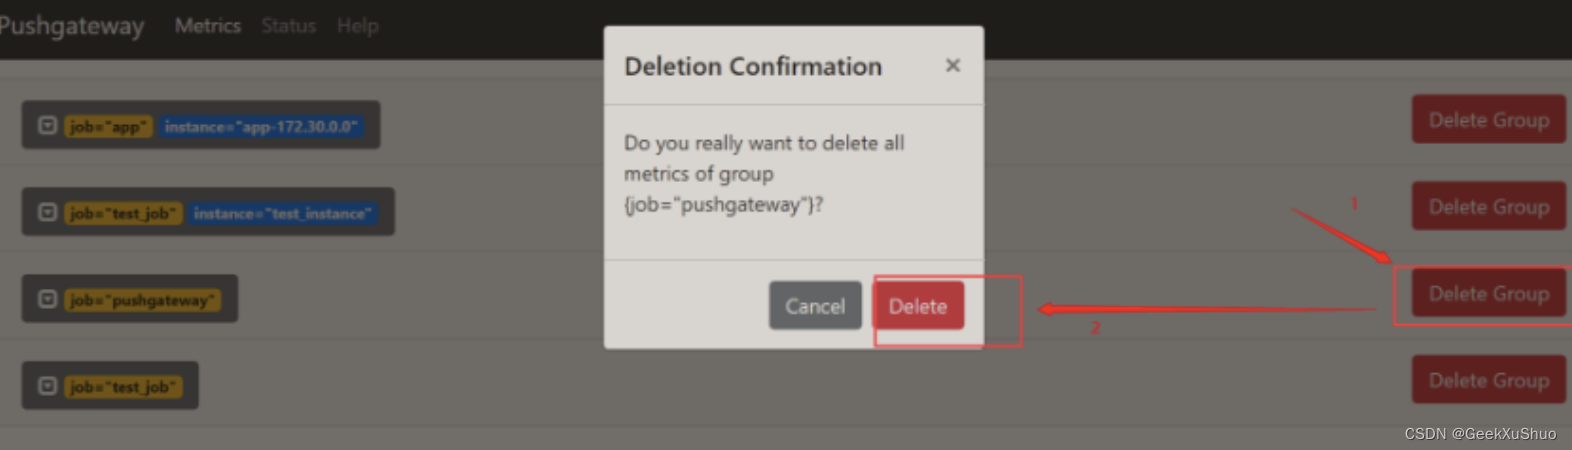
通过命令删除
curl -X DELETE http://localhost:9091/metrics/job/test_job
删除命令的注意事项
删除 job=“test_job” 组下的所有指标值,不包括 {job=“test_job”, instance=“test_instance”} 中的指标值,虽然它们的 job 名称都为 test_job
curl -X DELETE http://localhost:9091/metrics/job/test_job/instance/test_instance
PushGateway使用的注意事项
1、指标值只能是数字类型,非数字类型报错
2、指标值支持最大长度为 16 位,超过16 位后默认置为 0
3、PushGateway 数据持久化操作: 默认 PushGateway 不做数据持久化操作,当 PushGateway 重启或者异常挂掉,导致数据的丢失,可以通过启动时添加 -persistence.file 和 -persistence.interval 参数来持久化数据
docker run -d -p 9091:9091 prom/pushgateway "-persistence.file=pg_file –persistence.interval=5m"
4、PushGateway 推送及 Prometheus 拉取时间:设置 Prometheus 每次从 PushGateway 拉取的数据,并不是拉取周期内用户推送上来的所有数据,而是最后一次 Push 到 PushGateway 上的数据,所以推荐设置推送时间小于或等于 Prometheus 拉取的时间,这样保证每次拉取的数据是最新 Push 上来的.