使用Python创建分形图案

分形是无限复杂的模式,在不同的尺度上具有自相似性。例如,一棵树的树干会分裂成更小的树枝。这些树枝又分裂成更小的树枝,以此类推。
通过编程的方式生成分形,可以将简单的形状变成复杂的重复图案。
本文将探讨如何利用一些简单的几何学基础和编程知识,在Python中建立令人印象深刻的分形图案。
分形在数据科学中发挥着重要作用。例如,在分形分析中,对数据集的分形特征进行评估,以帮助理解基础过程的结构。此外,处于分形生成中心的循环算法可以应用于广泛的数据问题,例如从二进制搜索算法到递归神经网络。
一、目标
写一个可以画等边三角形的程序,并且在三角形的每条边上,它必须能够绘制一个稍微小一点的向外的三角形。能够根据人的意愿多次重复此过程,从而创建一些有趣的模式。
二、表示图像
把图像表示为一个二维的像素阵列。像素阵列中的每个单元格将代表该像素的颜色(RGB)。
为此,可以使用NumPy库生成像素数组,并使用Pillow将其转换为可以保存的图像。
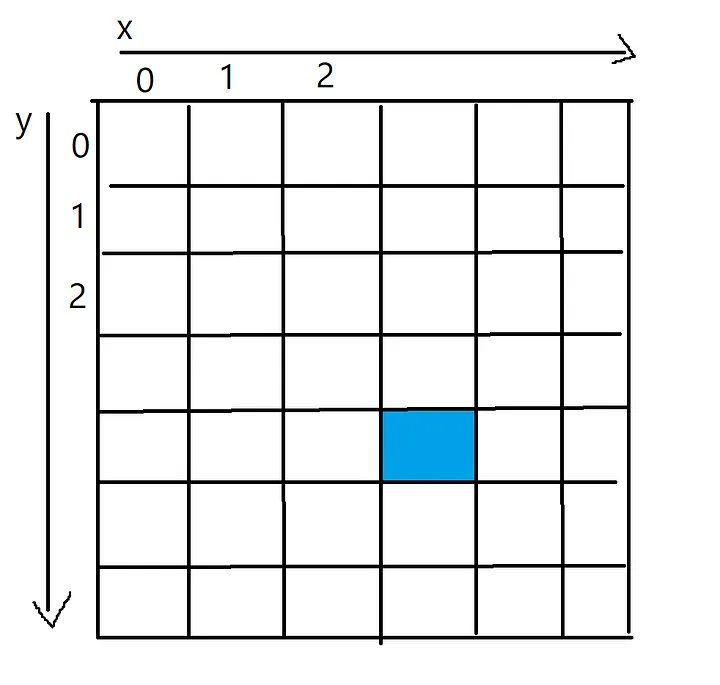
蓝色像素的x值为3,y值为4,可以通过一个二维数组访问,如pixels[4][3]
三、画一条线
现在开始编码,首先,需要一个可以获取两组坐标并在它们之间画一条线的函数。
下面的代码通过在两点之间插值来工作,每一步都向像素阵列添加新的像素。你可以把这个过程看作是在一条线上逐个像素地进行着色。
可以在每个代码片段中使用连续字符“\\”来容纳一些较长的代码行。
import numpy as np
from PIL import Image
import mathdef plot_line(from_coordinates, to_coordinates, thickness, colour, pixels):# 找出像素阵列的边界max_x_coordinate = len(pixels[0])max_y_coordinate = len(pixels)# 两点之间沿着x轴和y轴的距离horizontal_distance = to_coordinates[1] - from_coordinates[1]vertical_distance = to_coordinates[0] - from_coordinates[0]# 两点之间的总距离distance =  math.sqrt((to_coordinates[1] - from_coordinates[1])2 \\+ (to_coordinates[0] - from_coordinates[0])2)# 每次给一个新的像素上色时,将向前走多远horizontal_step = horizontal_distance/distancevertical_step = vertical_distance/distance# 此时,将进入循环以在像素数组中绘制线# 循环的每一次迭代都会沿着线添加一个新的点for i in range(round(distance)):# 这两个坐标是直线中心的坐标current_x_coordinate = round(from_coordinates[1] + (horizontal_step*i))current_y_coordinate = round(from_coordinates[0] + (vertical_step*i))# 一旦得到了点的坐标,# 就在坐标周围画出尺寸为thickness的图案for x in range (-thickness, thickness):for y in range (-thickness, thickness):x_value = current_x_coordinate + xy_value = current_y_coordinate + yif (x_value > 0 and x_value < max_x_coordinate and \\y_value > 0 and y_value < max_y_coordinate):pixels[y_value][x_value] = colour# 定义图像的大小
pixels = np.zeros( (500,500,3), dtype=np.uint8 )# 画一条线
plot_line([0,0], [499,499], 1, [255,200,0], pixels)# 把像素阵列变成一张真正的图片
img = Image.fromarray(pixels)# 显示得到的图片,并保存它
img.show()
img.save('Line.png')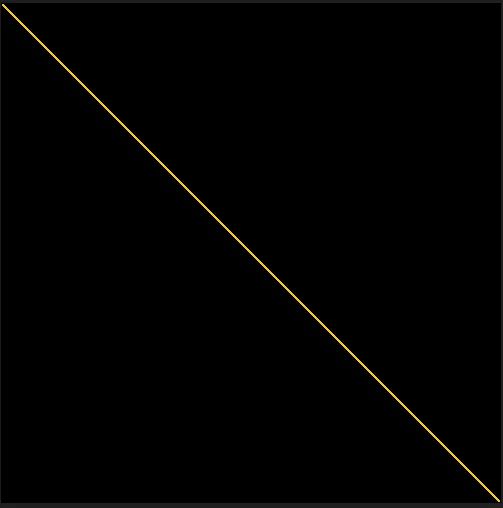
此函数在像素阵列的每个角之间绘制一条黄线时的结果
四、画三角形
现在有了一个可以在两点之间画线的函数,可以画第一个等边三角形了。
给定三角形的中心点和边长,可以使用公式计算出高度:h = ½(√3a)。
现在利用这个高度、中心点和边长,可以计算出三角形的每个角的位置。使用之前制作的plot_line函数,可以在每个角之间画一条线。
def draw_triangle(center, side_length, thickness, colour, pixels):# 等边三角形的高度是,h = ½(√3a)# 其中a是边长triangle_height = round(side_length * math.sqrt(3)/2)# 顶角top = [center[0] - triangle_height/2, center[1]]# 左下角bottom_left = [center[0] + triangle_height/2, center[1] - side_length/2]# 右下角bottom_right = [center[0] + triangle_height/2, center[1] + side_length/2]# 在每个角之间画一条线来完成三角形plot_line(top, bottom_left, thickness, colour, pixels)plot_line(top, bottom_right, thickness, colour, pixels)plot_line(bottom_left, bottom_right, thickness, colour, pixels)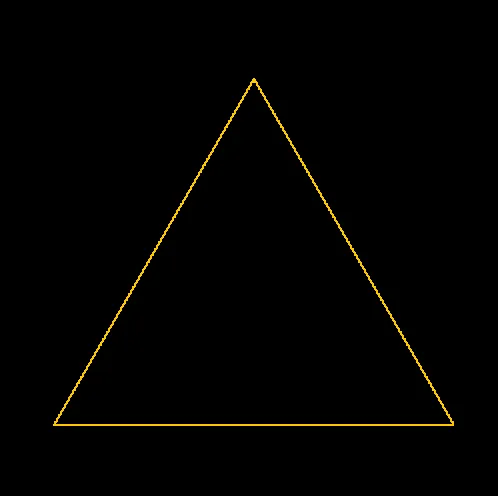
在500x500像素PNG的中心绘制三角形时的结果
五、生成分形
一切都已准备就绪,可以用Python创建第一个分形。
但是最后一步是最难完成的,三角形函数为它的每一边调用自己,需要能够计算每个新的较小三角形的中心点,并正确地旋转它们,使它们垂直于它们所附着的一侧。
通过从旋转的坐标中减去中心点的偏移量,然后应用公式来旋转一对坐标,可以用这个函数来旋转三角形的每个角。
def rotate(coordinate, center_point, degrees):# 从坐标中减去旋转的点x = (coordinate[0] - center_point[0])y = (coordinate[1] - center_point[1])# Python的cos和sin函数采用弧度而不是度数radians = math.radians(degrees)# 计算旋转点new_x = (x * math.cos(radians)) - (y * math.sin(radians))new_y = (y * math.cos(radians)) + (x * math.sin(radians))# 将在开始时减去的偏移量加回旋转点上return [new_x + center_point[0], new_y + center_point[1]]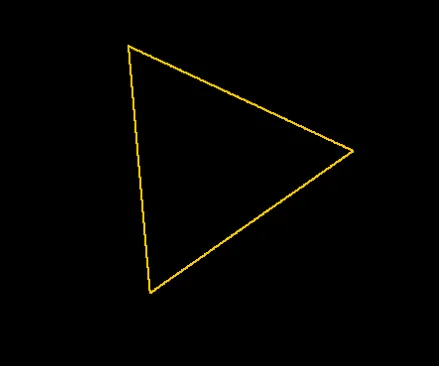
将每个坐标旋转35度的三角形
可以旋转一个三角形后,思考如何在第一个三角形的每条边上画一个新的小三角形。
为了实现这一点,扩展draw_triangle函数,为每条边计算一个新三角形的旋转和中心点,其边长被参数shrink_side_by减少。
一旦它计算出新三角形的中心点和旋转,它就会调用draw_triangle(自身)来从当前线的中心画出新的、更小的三角形。然后,这将反过来打击同一个代码块,为一个更小的三角形计算另一组中心点和旋转。
这就是所谓的循环算法,因为draw_triangle函数现在会调用自己,直到达到希望绘制的三角形的最大深度。有这个转义句子是很重要的,因为理论上这个函数会一直循环下去(但实际上调用堆栈会变得太大,导致堆栈溢出错误)。
def draw_triangle(center, side_length, degrees_rotate, thickness, colour, \\pixels, shrink_side_by, iteration, max_depth):# 等边三角形的高度是,h = ½(√3a)# 其中'a'是边长triangle_height = side_length * math.sqrt(3)/2# 顶角top = [center[0] - triangle_height/2, center[1]]# 左下角bottom_left = [center[0] + triangle_height/2, center[1] - side_length/2]# 右下角bottom_right = [center[0] + triangle_height/2, center[1] + side_length/2]if (degrees_rotate != 0):top = rotate(top, center, degrees_rotate)bottom_left = rotate(bottom_left, center, degrees_rotate)bottom_right = rotate(bottom_right, center, degrees_rotate)# 三角形各边之间的坐标lines = [[top, bottom_left],[top, bottom_right],[bottom_left, bottom_right]]line_number = 0# 在每个角之间画一条线来完成三角形for line in lines:line_number += 1plot_line(line[0], line[1], thickness, colour, pixels)# 如果还没有达到max_depth,就画一些新的三角形if (iteration < max_depth and (iteration < 1 or line_number < 3)):gradient = (line[1][0] - line[0][0]) / (line[1][1] - line[0][1])new_side_length = side_length*shrink_side_by# 正在绘制的三角形线的中心center_of_line = [(line[0][0] + line[1][0]) / 2, \\(line[0][1] + line[1][1]) / 2]new_center = []new_rotation = degrees_rotate# 需要旋转traingle的数量if (line_number == 1):new_rotation += 60elif (line_number == 2):new_rotation -= 60else:new_rotation += 180# 在一个理想的世界里,这将是gradient=0,# 但由于浮点除法的原因,无法# 确保永远是这种情况if (gradient < 0.0001 and gradient > -0.0001):if (center_of_line[0] - center[0] > 0):new_center = [center_of_line[0] + triangle_height * \\(shrink_side_by/2), center_of_line[1]]else:new_center = [center_of_line[0] - triangle_height * \\(shrink_side_by/2), center_of_line[1]]else:# 计算直线梯度的法线difference_from_center = -1/gradient# 计算这条线距中心的距离# 到新三角形的中心distance_from_center = triangle_height * (shrink_side_by/2)# 计算 x 方向的长度,# 从线的中心到新三角形的中心x_length = math.sqrt((distance_from_center2)/ \\(1 + difference_from_center2))# 计算出x方向需要走哪条路if (center_of_line[1] < center[1] and x_length > 0):x_length *= -1# 现在计算Y方向的长度y_length = x_length * difference_from_center# 用新的x和y值来偏移线的中心new_center = [center_of_line[0] + y_length, \\center_of_line[1] + x_length]draw_triangle(new_center, new_side_length, new_rotation, \\thickness, colour, pixels, shrink_side_by, \\iteration+1, max_depth)

三角形分形,收缩边=1/2,最大深度=2
六、结论
下面是通过修改输入到draw_triangle函数的shrink_side_by和max_depth值生成的不同图像的一些示例。
有趣的是,这些多次重复的图案往往能创造出更复杂的形状,比如六边形,但却具有令人着迷的对称性。
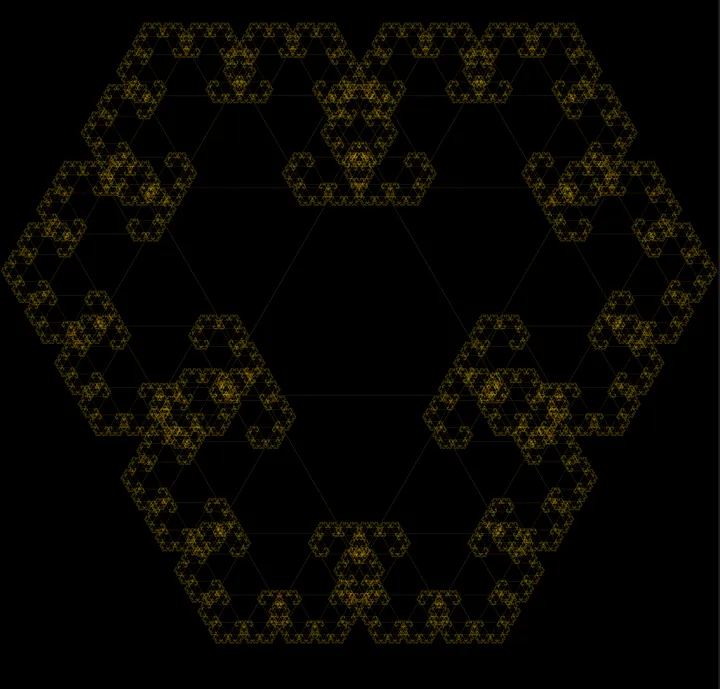
越来越复杂的形状开始在重复三角形的对称性中出现
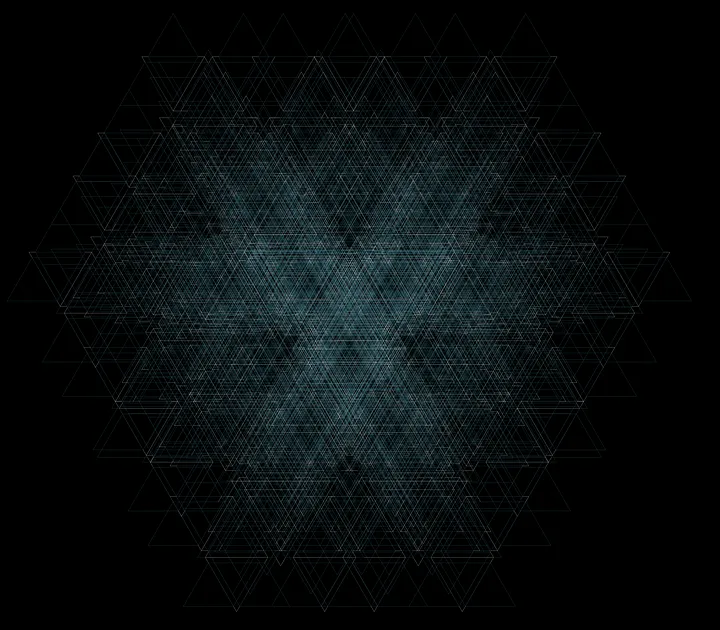
另一个分形,每次迭代使用较小的尺寸减小
分形是非常有趣的玩法,可以创造出美丽的图案。使用一些简单的概念和丰富的创造力,可以产生非常令人印象深刻的结构。
在理解分形的核心属性和应用循环算法的过程中打下的坚实基础,可以帮助理解数据科学中更复杂的分形问题。