Taro+Vue3 小程序引入echarts表

背景:根据需求在一个报告界面需要展示不同的echarts表来使数据更友好的显示。
效果如下: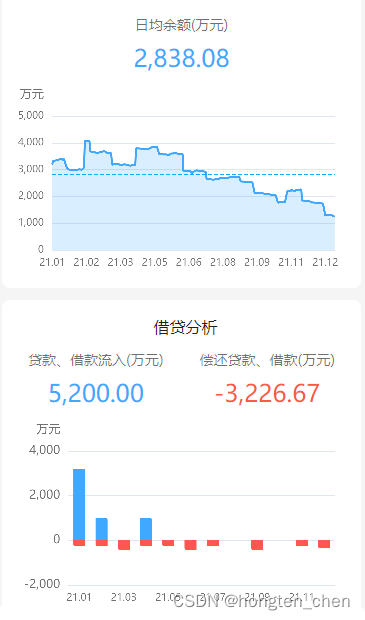
一.taro支持echarts
官方说明:Taro 文档支持引用小程序端第三方组件库
物料文档:Taro 物料市场 | 让每一个轮子产生价值
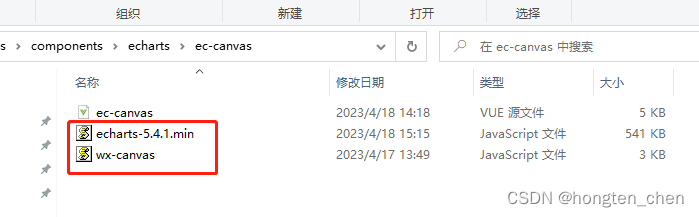
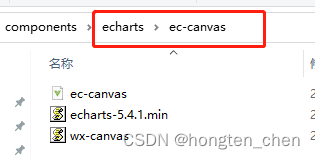
二.引入echarts-for-weixin插件
github地址: https://github.com/ecomfe/echarts-for-weixin
只引入ec-canvas文件夹下的wx-canvas.js
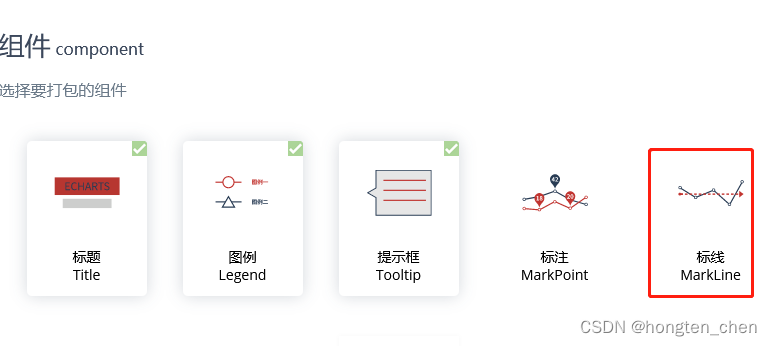
三.自定义 下载echarts
地址: https://echarts.apache.org/zh/builder.html
可自行选择版本,笔者测试了5.3.3和5.4.1都支持
下载后得到echarts.min.js
请根据需要自行选择需要的图表打包下载,我只选了默认的饼图、柱图、线图;
注意点:折线图中如果需要显示面积图的平均线,则要下载对应的标线组件。
经过三、四步骤之后会得到两个文件,目录结构如下:
四.封装组件ec-canvas.vue
<template><canvastype="2d"class="ec-canvas":class="canvasId" // 多个echarts时将canvasId作为唯一标识,动态获取canvasId用于多个                                                                           echarts可同时显示:canvas-id="canvasId"@touchStart="touchStart"@touchMove="touchMove"@touchEnd="touchEnd"></canvas>
</template><script lang="js">
import Taro from "@tarojs/taro";
import WxCanvas from "./wx-canvas";
import * as echarts from "./echarts-5.4.1.min";export default {name: "EcCanvas",props: {canvasId: {type: String,default: ""},ec: {type: Object,default: null}},mounted() {echarts.registerPreprocessor(option => {if (option && option.series) {if (option.series.length > 0) {option.series.forEach(series => {series.progressive = 0;});} else if (typeof option.series === "object") {option.series.progressive = 0;}}});if (!this.ec) {console.warn('组件需绑定 ec 变量,例:<ec-canvas id="mychart-dom-bar" ' +'canvas-id="mychart-bar" ec="{{ ec }}"></ec-canvas>');return;}if (!this.ec.lazyLoad) {this.init();}},methods: {init(callback) {this.initByNewWay(callback);},initByNewWay(callback) {const query = Taro.createSelectorQuery();query.select(`.${this.canvasId}`) // 根据canvasId动态获取不同的echarts图表.fields({node: true,size: true}).exec(res => {if (!res || res.length == 0 || res[0] == null || res[0].node == null) {console.error('未获取到canvas的dom节点,请确认在页面渲染完成后或节点,taro中页面渲染完成的生命周期是useReady');return}const canvasNode = res[0].node;// this.canvasNode = canvasNode;const canvasDpr = Taro.getSystemInfoSync().pixelRatio;const canvasWidth = res[0].width;const canvasHeight = res[0].height;const ctx = canvasNode.getContext("2d");const canvas = new WxCanvas(ctx, this.canvasId, true, canvasNode);echarts.setCanvasCreator(() => {return canvas;});if (typeof callback === "function") {this.chart = callback(canvas, canvasWidth, canvasHeight, canvasDpr);} else if (typeof this.ec.onInit === "function") {this.chart = this.ec.onInit(canvas,canvasWidth,canvasHeight,canvasDpr);} else {this.triggerEvent('init', {canvas: canvas,width: canvasWidth,height: canvasHeight,dpr: canvasDpr})}});},canvasToTempFilePath(opt) {const query = Taro.createSelectorQuery().in(this);query.select(".ec-canvas").fields({node: true,size: true}).exec(res => {const canvasNode = res[0].node;opt.canvas = canvasNode;Taro.canvasToTempFilePath(opt);});},touchStart(e) {if (this.chart && e.touches.length > 0) {var touch = e.touches[0];var handler = this.chart.getZr().handler;handler.dispatch("mousedown", {zrX: touch.x,zrY: touch.y});handler.dispatch("mousemove", {zrX: touch.x,zrY: touch.y});handler.processGesture(this.wrapTouch(e), "start");}},touchMove(e) {if (this.chart && e.touches.length > 0) {var touch = e.touches[0];var handler = this.chart.getZr().handler;handler.dispatch("mousemove", {zrX: touch.x,zrY: touch.y});handler.processGesture(this.wrapTouch(e), "change");}},touchEnd(e) {if (this.chart) {const touch = e.changedTouches ? e.changedTouches[0] : {};var handler = this.chart.getZr().handler;handler.dispatch("mouseup", {zrX: touch.x,zrY: touch.y});handler.dispatch("click", {zrX: touch.x,zrY: touch.y});handler.processGesture(this.wrapTouch(e), "end");}},wrapTouch(event) {for (let i = 0; i < event.touches.length; ++i) {const touch = event.touches[i];touch.offsetX = touch.x;touch.offsetY = touch.y;}return event;}}
};
</script><style>
.ec-canvas {width: 100%;min-height: 400rpx;flex: 1;
}
</style>
五.封装e-chart.vue组件
<template><ec-canvas ref="ecCanvasRef" :canvas-id="canvasId" :ec="ec"></ec-canvas>
</template><script lang="js">
/* 自定义下载的echarts.min.js 文件  要使用需使用js,ts需要声明文件* 此组件不能使用setup语法糖,会报错的.*/
import Taro, { useLoad } from "@tarojs/taro";
import * as echarts from './ec-canvas/echarts-5.4.1.min'
import EcCanvas from './ec-canvas/ec-canvas.vue'
import { ref, reactive } from "vue";
export default {components: {EcCanvas},props: {canvasId: {type: String,default: ''}},setup(props, { expose }) {const ec = reactive({lazyLoad: true})const ecCanvasRef = ref(null);const refresh = (options) => {if (!ecCanvasRef.value) {console.error('ecCanvas未获取到dom');return}ecCanvasRef.value?.init((canvas, width, height, canvasDpr) => {const chart = echarts.init(canvas, null, {width: width,height: height,devicePixelRatio: canvasDpr})canvas.setChart(chart);chart.setOption(options);return chart;})}expose({refresh,})return {// 返回值会暴露给模板和其他的选项式 API 钩子ec, ecCanvasRef}},
}
</script>
六.使用封装的组件
此时封装的目录结构如下:
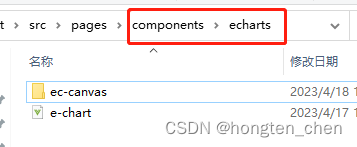
子组件:
<template><view class="cards bg-white mx-sm mt-mm"><view class="text-center pt-xs pb-mm"><text class="text-md text-dark ml-sm">借贷分析</text></view><cover-view class="container-echarts"><e-chart ref="barChat" canvas-id="bar-canvas" /></cover-view></view>
</template>
<script lang="ts">
export default { name: 'loanAnalysis' };
</script><script lang="ts" setup>
import Taro, { useReady } from '@tarojs/taro';
import { ref } from 'vue';
import EChart from '../components/echarts/e-chart.vue';
import { getLoanView } from '@/service/report';
import { MoneyNoUnitText, FormatThousand } from '@/units/currency';const components = { 'e-chart': EChart };const props = defineProps({params: { type: Object, required: true }
});useReady(() => {initMultiBarChart();
});
const barChat = ref<any>();
let loanAmount = ref<number>();
let repaymentLoanAmount = ref<number>();
let prototypeOption = {grid: { left: 14, right: 18, bottom: 8, top: 40, containLabel: true },legend: { show: false },color: ['#40a9ff', '#FF5652'],xAxis: [{type: 'category',data: [],axisLabel: { fontSize: 10, color: 'rgba(0, 0, 0, 0.56)' },axisLine: { show: false },axisTick: { show: false }}],yAxis: [{type: 'value',name: '万元',nameTextStyle: { padding: [0, 40, 0, 0], color: 'rgba(0,0,0,0.56)' },axisLabel: { fontSize: 10, color: 'rgba(0, 0, 0, 0.56)' },axisLine: { show: false },axisTick: { show: false },splitNumber: 2}],series: [{name: '贷款、借款流入',type: 'bar',data: [],barMaxWidth: 12,barMinHeight: 1,stack: 'cr',itemStyle: {barBorderRadius: [0, 2, 0, 0]}},{name: '偿还贷款、借款',type: 'bar',data: [],barMaxWidth: 12,barMinHeight: 1,stack: 'cr',itemStyle: {barBorderRadius: [0, 0, 0, 2]}}]
};const initMultiBarChart = () => {getLoanView(props.params).then(res => {if (res) {loanAmount.value = MoneyNoUnitText(res.loanAmount || 0);repaymentLoanAmount.value = MoneyNoUnitText(res.repaymentLoanAmount || 0);prototypeOption.xAxis[0].data = res.list.map(i => i.dateId.toString().slice(2, 4) + '.' + i.dateId.toString().slice(4));prototypeOption.yAxis[0].axisLabel = {formatter: (v: any) => (Math.abs(v) > 0 ? FormatThousand(parseInt(v / 10000), 0) : v),color: 'rgba(0, 0, 0, 0.56)'};prototypeOption.series[0].data = res.list.map(i => (i.loanAmount > 0 ? i.loanAmount : null));prototypeOption.series[1].data = res.list.map(i =>i.repaymentLoanAmount > 0 ? -i.repaymentLoanAmount : null);Taro.nextTick(() => {barChat.value.refresh(prototypeOption);});}});
};
</script><style>
.container-echarts {height: 400rpx;width: 100%;
}
</style>
父组件引用子组件:
import loanAnalysis from './loan-analysis.vue';<loan-analysis :params="params"></loan-analysis>【 问题描述 】在小程序使用echarts,图表展示出来之后不跟随页面滚动,浮在最上方。
【 问题原因 】布局中含有position:fixed或absulote的元素,导致echarts图表无法滑动。
官方文件说明:canvas为原生组件故有一下的性质: bash 由于原生组件脱离在 WebView
渲染流程外,因此在使用时有以下限制: 组件的层级是最高的,所以页面中的其他组件无论设置z-index 为多少,都无法盖在原生组件上。 后插入的原生组件可以覆盖之前的原生组件。
原生组件还无法在 scroll-view、swiper、picker-view、movable-view 中使用。
部分CSS样式无法应用于原生组件,例如: 无法对原生组件设置 CSS 动画 无法定义
原生组件为 position: fixed 不能在父级节点使用 overflow:hidden 来裁剪
原生组件的显示区域
【 解决方法 】所有父级元素(有包含ec-canvas的所有view元素)的position不可为
fixed或absulote,将其改为其他,另外兄弟元素可以为position:absulote或fixed,
否在还是会有重叠原文链接:https://blog.csdn.net/samscat/article/details/126182735
参考博文:Taro3+Vue3使用echarts_taro使用echarts_江渚清沨的博客-CSDN博客