学习笔记 -- C++性能评估工具Perf

Installation
sudo apt update
sudo apt install linux-tools-common
查看你的内核:
uname -r
我的输出:
$ uname -r
5.15.0-67-generic
安装对应的 tools:
sudo apt install linux-tools-5.15.0-67-generic
Implementation
1、Perf List 状态参数列表
run perf list 得到可检测的状态(stat)参数列表, 包括硬件(Hardware)和软件(Software)的
List of pre-defined events (to be used in -e):cpu-cycles OR cycles [Hardware event]stalled-cycles-frontend OR idle-cycles-frontend [Hardware event]stalled-cycles-backend OR idle-cycles-backend [Hardware event]instructions [Hardware event]cache-references [Hardware event]cache-misses [Hardware event]branch-instructions OR branches [Hardware event]branch-misses [Hardware event]bus-cycles [Hardware event]cpu-clock [Software event]task-clock [Software event]page-faults OR faults [Software event]minor-faults [Software event]major-faults [Software event]context-switches OR cs [Software event]cpu-migrations OR migrations [Software event]alignment-faults [Software event]emulation-faults [Software event]L1-dcache-loads [Hardware cache event]L1-dcache-load-misses [Hardware cache event]L1-dcache-stores [Hardware cache event]L1-dcache-store-misses [Hardware cache event]L1-dcache-prefetches [Hardware cache event]L1-dcache-prefetch-misses [Hardware cache event]L1-icache-loads [Hardware cache event]...
2、PERF usage Modes: Counting and Sampling
PERF 支持两种使用模式:计数(Counting)和采样(Sampling)。
计数Counting模式:将指定的监测事件计数,计数值可以是每进程/线程或整个系统的,最终得到监测事件的总计数,不涉及与时间相关的测量。
Counting方式的优点是只需要在事件发生时记录一下计数器即可,因此对系统的性能影响较小。但它并不能告诉我们事件的时间分布情况,因此不能得到事件的节奏信息,例如事件发生的频率随时间的变化情况等。
采样Sampling模式:定期对正在运行的线程/进程进行抽样,以获得事件发生的时间、持续时间、事件发生的上下文等信息。它利用计时器在一段时间内定期采样正在执行的线程/进程状态,其采样率(weight)越高,则可以发现更多的事件,得到更加准确的监测结果。
Sampling方式的优点是可以得到时间信息,便于分析性能瓶颈与更好地理解系统软硬件之间的交互。
2.1 Implement of Counting mode
可以使用perf stat命令来获取counting mode下的统计信息,例如:
perf stat -e cpu-cycles instructions L1-dcache-load-misses ./a.out
如果你在运行一些 perf 命令时遇到下面问题:
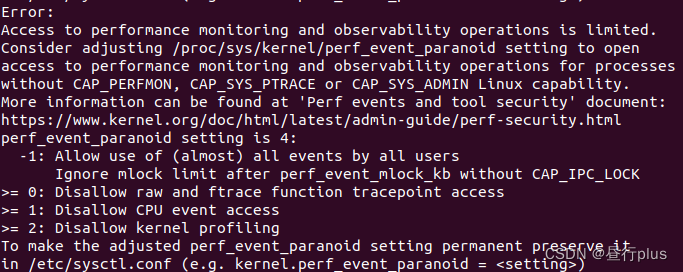
命令行运行:
sudo gedit /proc/sys/kernel/perf_event_paranoid  # 内容改成 -1
sudo gedit /etc/sysctl.conf # 末尾加入 kernel.perf_event_paranoid = -1
2.2 Implement of Sampling
# sampling mode
perf record -e cpu-clock instructions L1-dcache-load-misses -F 1000 ./a.out
perf report # 查看采样结果
其中 -F 用以指定采样频率
或者
# sampling mode
perf record -e cpu-clock instructions L1-dcache-load-misses  -c 100000 ./a.out
perf report # 查看采样结果
其中 -C 100000 代表固定采样周期为100,000 个 cpu-cycles。
如果未设置采样频率或采样周期,默认采样频率为1000Hz。
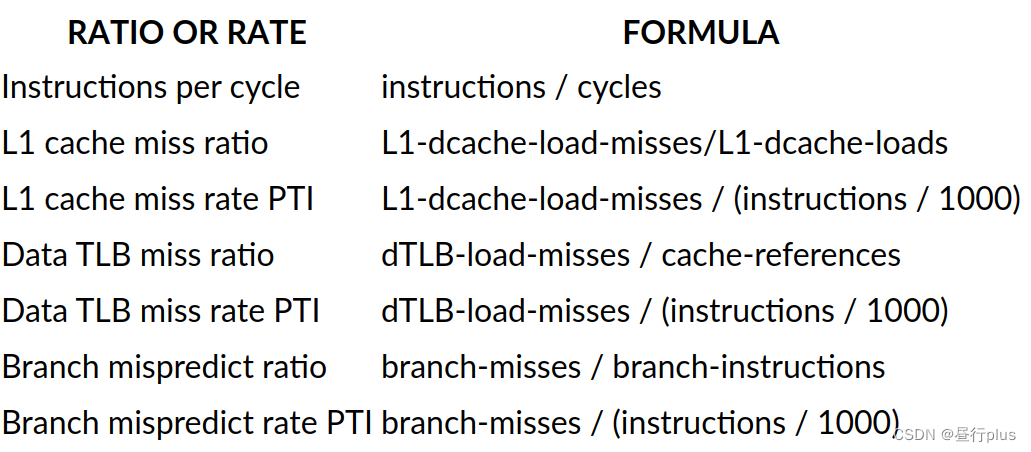
2.3 Ratios and rates
由于原始事件信息不容易直接反应代码性能。 比如52,202,548 次cache-miss 代表什么样的性能?因此使用比率(Ratio)通常比单一原始事件计数更清晰。
如下是一些常用的用于评估性能的比率参数:
Reference
Installing and Using Perf in Ubuntu and CentOS