Echarts 如何添加页脚元素

-
要在 Echarts 图表中添加页脚元素,可以通过在 Echarts 实例的配置对象中添加 graphic 元素来实现。graphic 元素是一个数组形式的配置项,可以通过其中的 text 元素添加文字,rect 元素添加矩形,image 元素添加图片等,从而实现页脚的自定义布局。
-
以下是一个简单的示例代码:
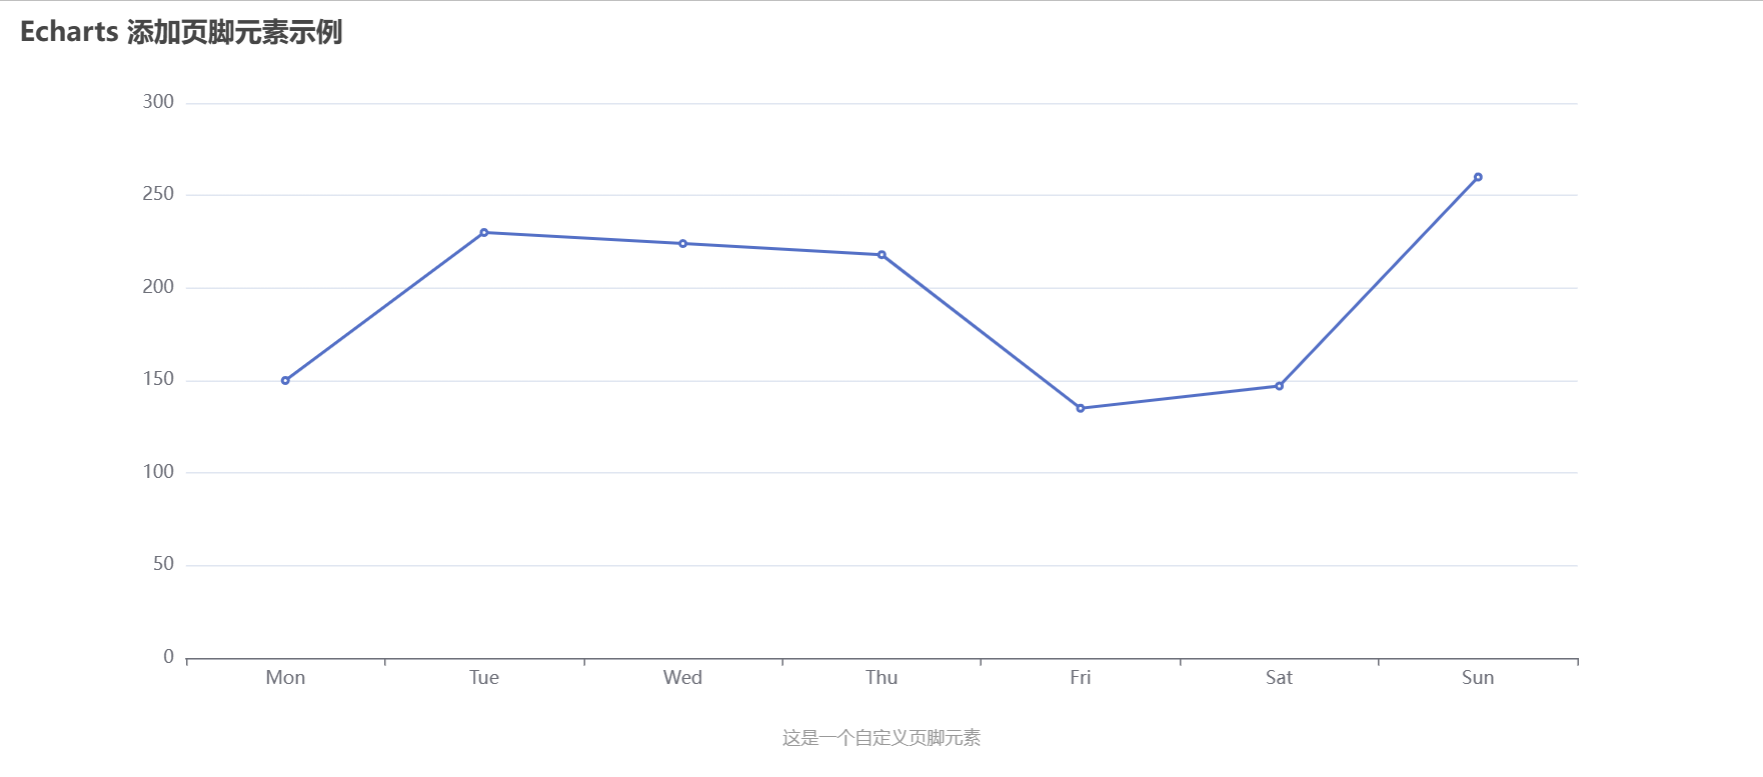
<!DOCTYPE html> <html> <head><meta charset="UTF-8"><title>Echarts 添加页脚元素</title><script src="https://cdn.bootcdn.net/ajax/libs/echarts/5.1.1/echarts.min.js"></script> </head> <body><div id="my-chart" style="height: 500px;"></div><script>// 基于准备好的 DOM 容器,初始化 Echarts 实例let myChart = echarts.init(document.querySelector("#my-chart"));// 配置项let option = {title: {text: 'Echarts 添加页脚元素示例'},xAxis: {type: 'category',data: ['Mon', 'Tue', 'Wed', 'Thu', 'Fri', 'Sat', 'Sun']},yAxis: {type: 'value'},series: [{data: [150, 230, 224, 218, 135, 147, 260],type: 'line'}],// 添加图表底部的自定义元素graphic: [{type: 'text',left: 'center',bottom: 10,style: {text: '这是一个自定义页脚元素',textAlign: 'center',fill: '#999'}}, {type: 'rect',left: '0',bottom: '0',shape: {width: '100%',height: '10%',},style: {fill: '#eee'}}]};// 使用刚指定的配置项和数据显示图表myChart.setOption(option);</script> </body> </html> -
在上面的代码中,通过在配置对象中添加 graphic 元素,使用 type: ‘text’ 和 type: ‘rect’ 分别创建了一个文本元素和一个矩形元素,并设置了它们的位置、大小、文本内容、样式等属性。在实际应用中,也可以使用其他的 type 类型,根据需要进行自定义。
-
需要注意的是,添加 graphic 元素时要考虑图表的尺寸和布局,以免遮挡或影响图表的内容展示。同时,在设置样式时,也要注意文本、矩形等元素的字体、颜色、透明度等属性,以适应不同的图表风格和需求。