【开发】中间件——ElasticStack

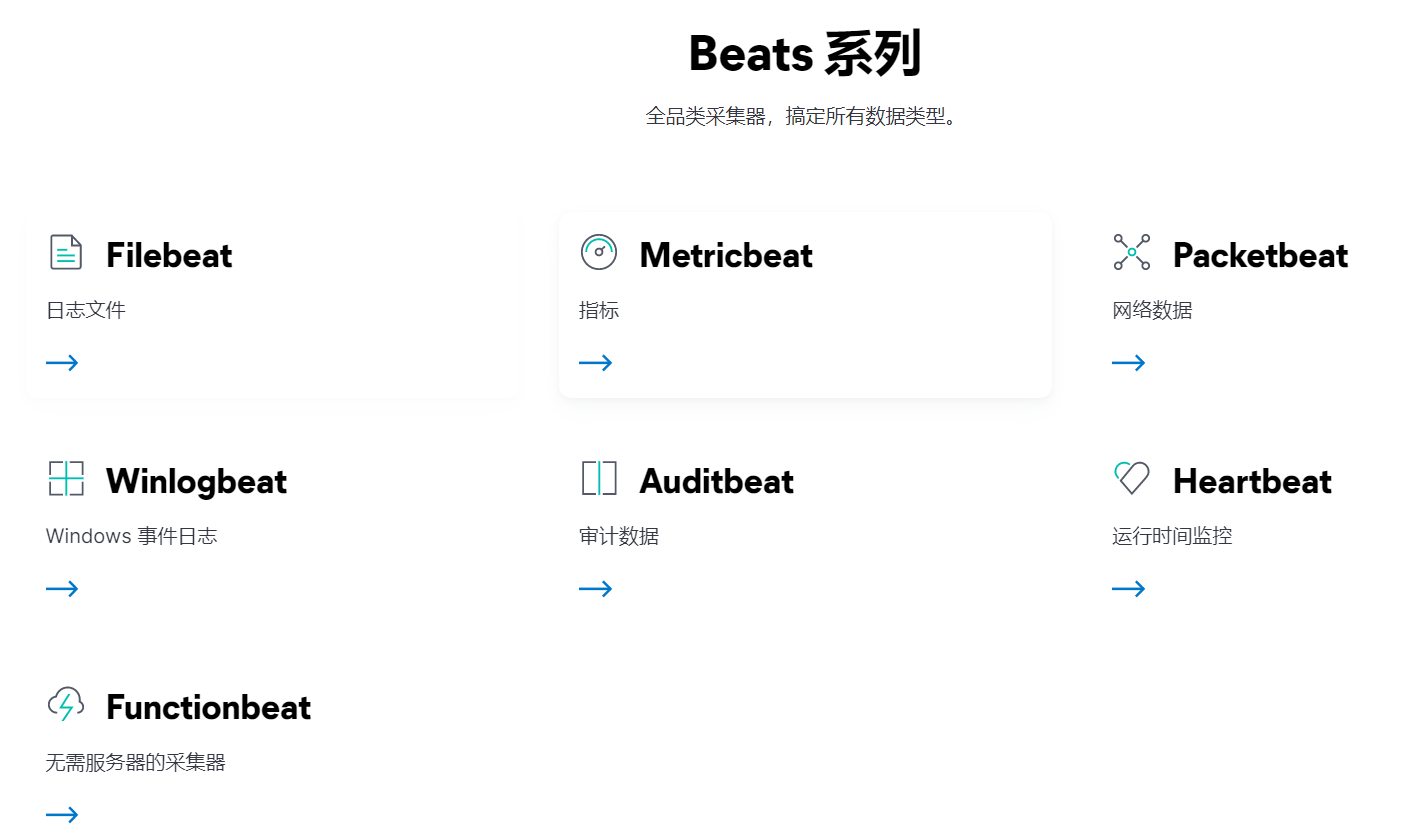
- Beats
- FileBeat
- Metricbeat
- Kibana
- Logstash
ElasticStack
简介
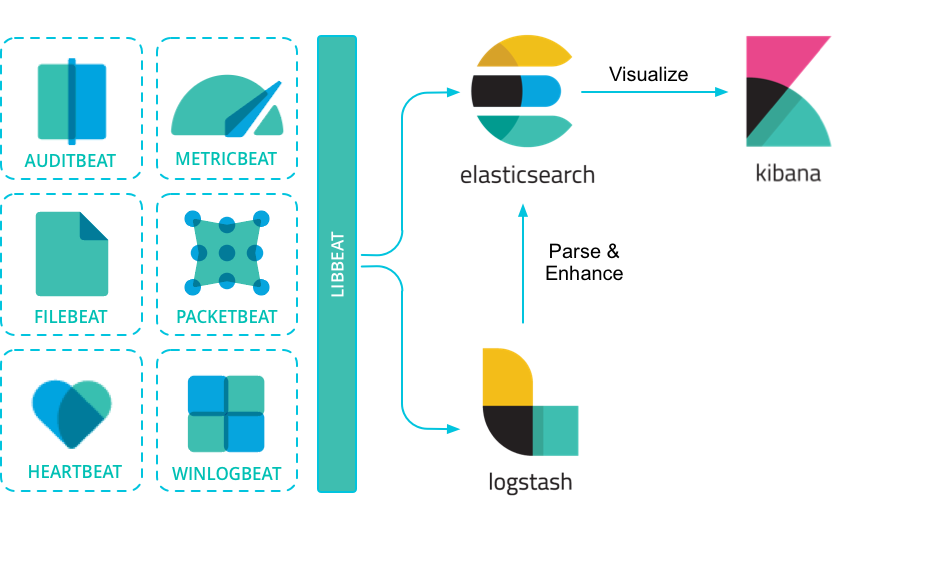
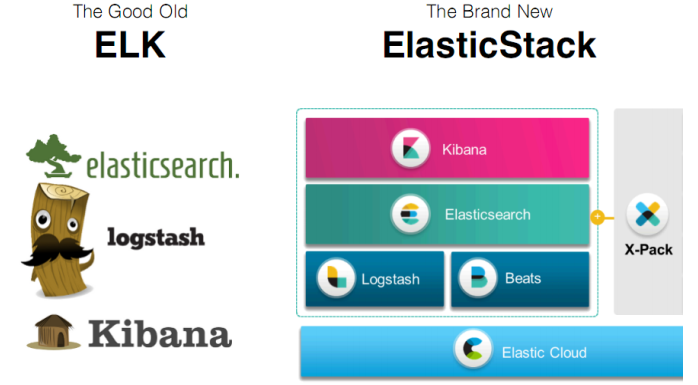
ELK(旧称呼),由ElasticSearch、Logstash、Kibana组成,及新加入的Beats
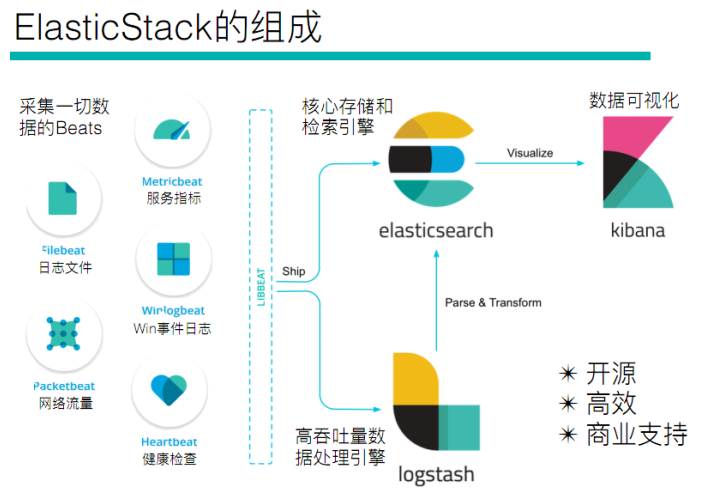
Beats
采集系统监控数据的代理,是在被监控服务器上以客户端形式运行的数据收集器的统称。可以直接把数据发送给ElasticSearch或者通过LogStash发送给ElasticSearch,然后进行后续的数据分析活动
Beats组成
- PacketBeat:网络数据分析器,用于监控、收集网络流量信息、Packetbeat嗅探服务器之间的流
量,解析应用层协议,并关联到消息的处理,其支 持ICMP (v4 and v6)、DNS、HTTP、Mysql、PostgreSQL、Redis、MongoDB、Memcache等协议; - Filebeat:用于监控、收集服务器日志文件,其已取代 logstash forwarder
- Metricbeat:可定期获取外部系统的监控指标信息,其可以监控、收集 Apache、HAProxy、MongoDB 、MySQL、Nginx、PostgreSQL、Redis、System、Zookeeper等服务;
- Winlogbeat:用于监控、收集Windows系统的日志信息;
Logstash
基于Java,可以用于手机,分析和存储日志的工具
由于与Beats功能部分重叠,现用于数据处理
ElasticSearch
基于Java,是开源分布式搜索引擎,特点有:分布式、零配置、自动发现,索引自动分片、索引副本机制、restful风格接口,多数据源、自动搜索负载
Kibana
基于nodejs,开源免费工具,Kibana可以为Logstash和ElasticSearch提供的日志分析友好的web界面,可以汇总、分析和搜索重要数据日志
Beats——日志采集
Beats:Elasticsearch 的数据采集器 | Elastic
FileBeat
架构
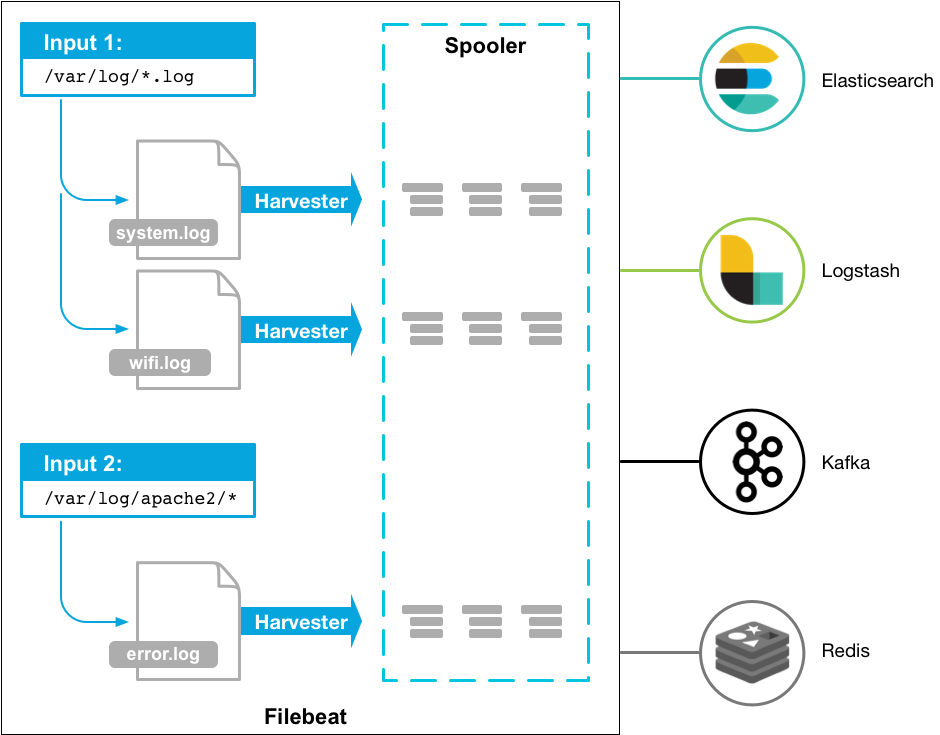
FileBeat 由主要组件组成:prospector 和 harvester
-
harvester
负责读取单个文件内容
如果文件在读取时被删除或重命名,FileBeat将会继续读取文件
-
Prospector
prospector 负责管理
harvester,并查找所有要读取的文件来源如果输入类型为日志,则查找器将查找路径匹配的所有文件,并为每个文件启动一个 harvester
FileBeat支持两种
prospector:log 和 stdin
Filebeat如何记录文件的状态
- Filebeat 保存每个文件的状态并经常将状态刷新到磁盘上的注册文件中
- 该状态用于记住harvester 正在读取的最后偏移量,并确保发送所有日志行
- 如果输出(Elasticsearch或Logstash)无法访问,Filebeat会跟踪最后发送的行,并在输出再次可用时继续读取文件
- 在Filebeat运行时,每个
prspector内存中也会保存文件状态信息,当重新启动FileBeat时,将使用注册文件/data/registry的数据来重建文件状态 - 文件状态记录在
/data/registry
部署与运行
mkdir -p /haoke/beats
tar -xvf filebeat-6.5.4-linux-x86_64.tar.gz
cd filebeat-6.5.4-linux-x86_64
启动命令
./filebeat -e -c haoke.yml
./filebeat -e -c haoke.yml -d "publish"#参数
-e: 输出到标准输出,默认输出到syslog和logs下
-c: 指定配置文件
-d: 输出debug信息
标准输入
# 创建配置文件 haoke.yml
filebeat.inputs:
- type: stdinenabled: true
output.console:pretty: trueenable: true
# es分片数
setup.template.settings:index.number_of_shards: 3# 启动 filebeat
./filebeat -e -c haoke.yml
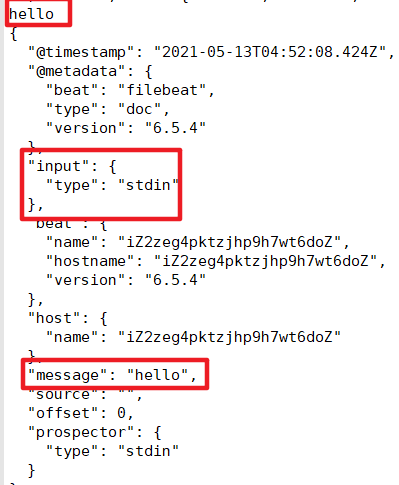
- @metadata :元数据信息
- message:输入的信息
- prospector:标准输入勘探器
- input:控制台标准输入
- beat:beat版本以及主机信息
读取文件
cd filebeat-6.5.4-linux-x86_64# haoke-log.yml 配置读取文件项
filebeat.inputs:
- type: logenabled: truepath: /haoke/beats/logs/*.log
output.console:pretty: trueenable: true
# es分片数
setup.template.settings:index.number_of_shards: 3# 启动filebeat
./filebeat -e -c haoke-log.yml# /haoke/beats/logs下创建a.log,并输入
hello
world# 观察filebeat输出
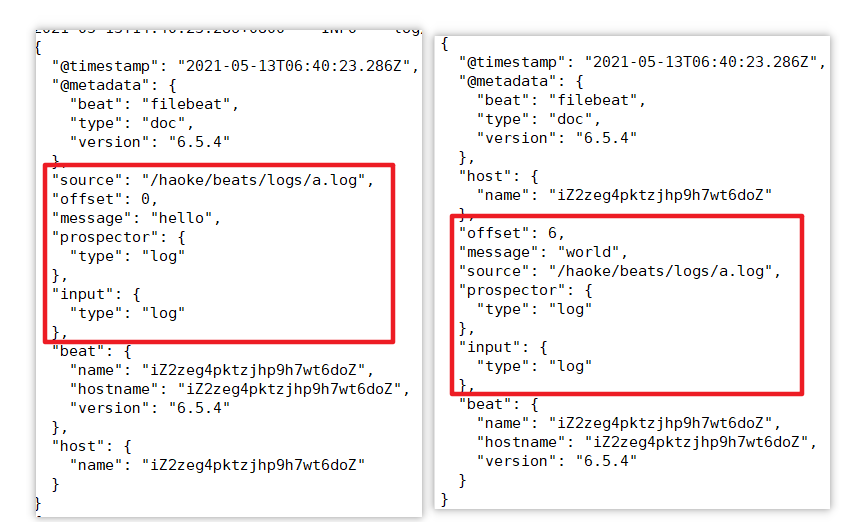
可见,已经检测到日志文件有更新,立刻就会读取到更新的内容,并且输出到控制台
自定义字段
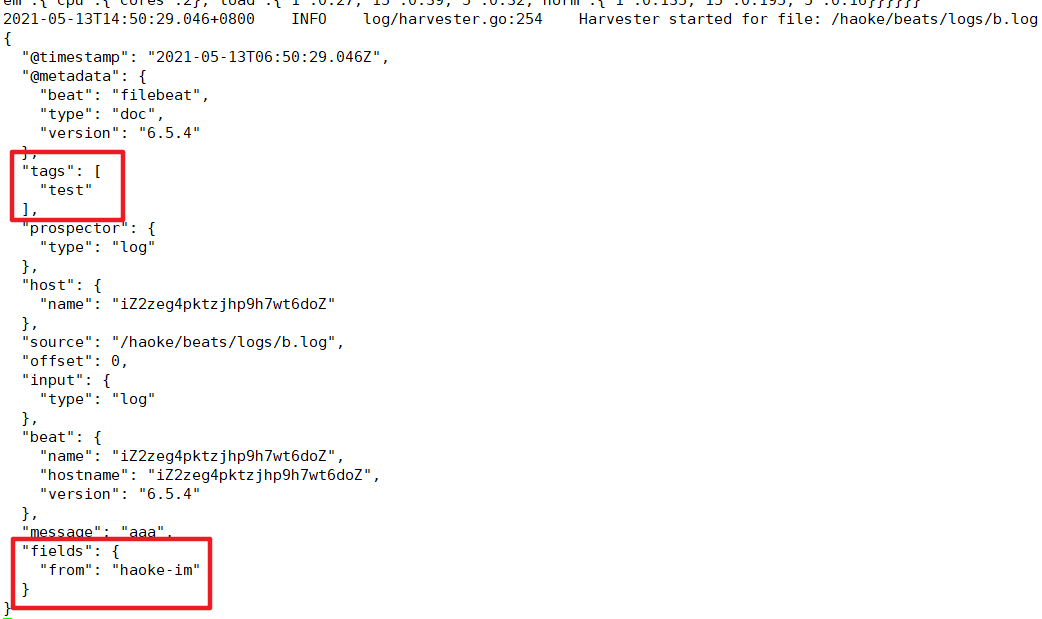
#配置读取文件项 haoke-log.yml
filebeat.inputs:
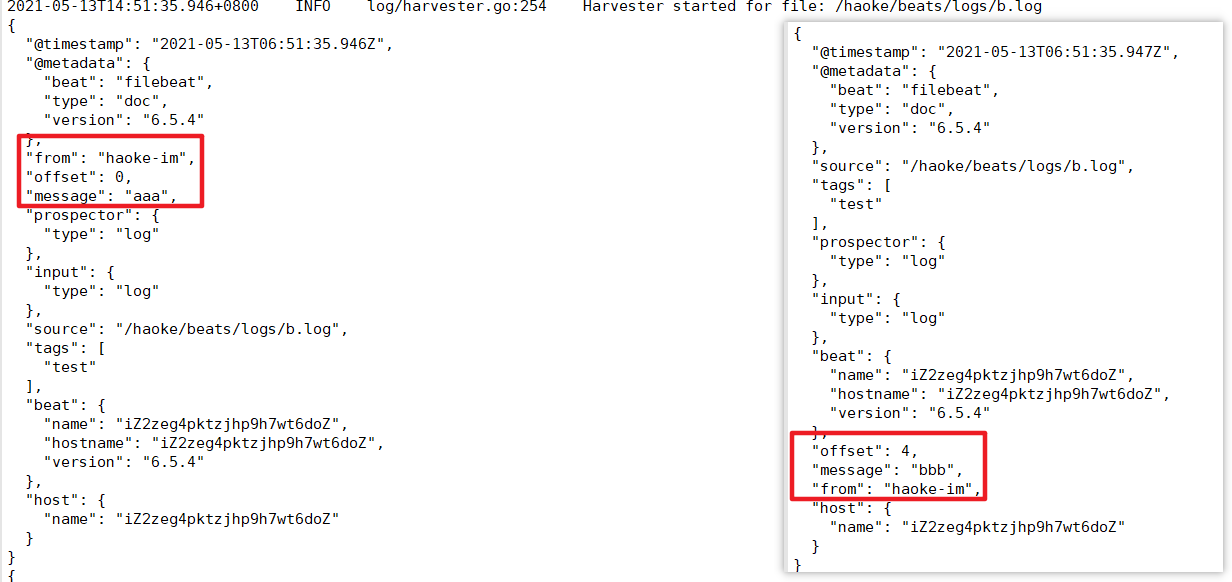
- type: logenabled: truepath: /haoke/beats/logs/*.logtags: ["test"] #添加自定义tag ,便于后续的处理fields: from: haoke-imfields_under_root: false #true为添加到根结点,false为添加到根结点下的fields属性下
output.console:pretty: trueenable: true
# es分片数
setup.template.settings:index.number_of_shards: 3# 启动filebeat
./filebeat -e -c haoke-log.yml# /haoke/beats/logs/下创建b.log 写入以下内容
123
fields_under_root: false
fields_under_root: true
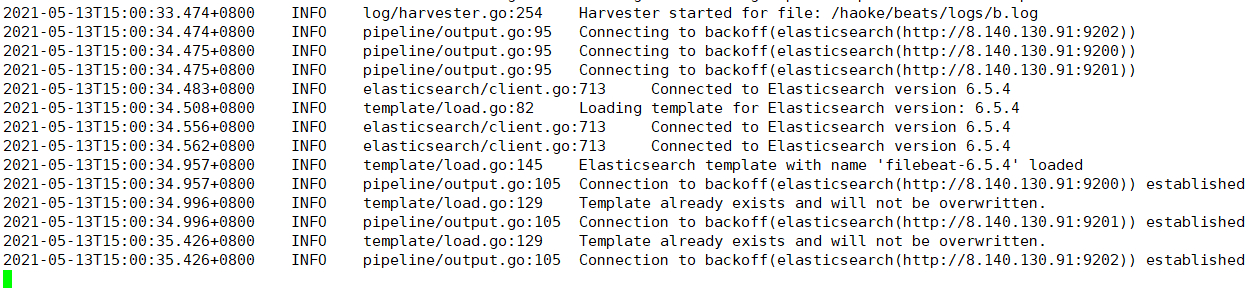
输出到ES
#配置读取文件项 haoke-log.yml
filebeat.inputs:
- type: logenabled: truepath: /haoke/beats/logs/*.logtags: ["test"] #添加自定义tag ,便于后续的处理fields: from: testfields_under_root: false #true为添加到根结点,false为添加到根结点下的fields属性下
output.elasticsearch: #指定ES配置hosts: ["8.140.130.91:9200","8.140.130.91:9201","8.140.130.91:9202"]
# es分片数
setup.template.settings:index.number_of_shards: 3# 指定索引的分区数

Module
前面想要实现日志数据的读取以及处理都是自己手动配置,其实,在 Filebeat 中,有大量的Module,可以简化配置
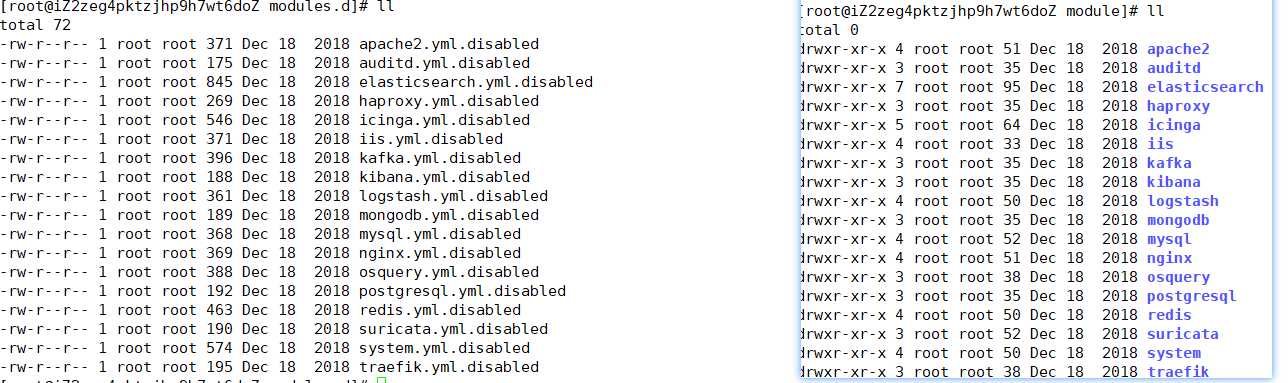
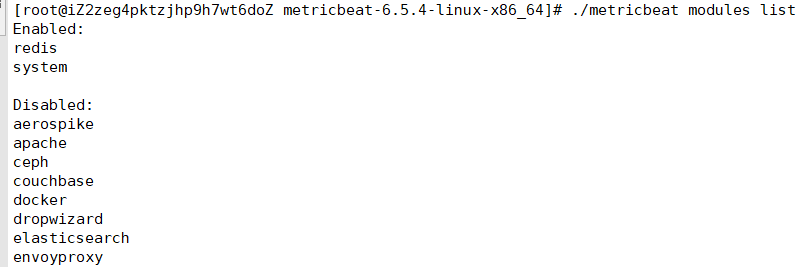
./filebeat modules listEnabled:Disabled:
apache2
auditd
elasticsearch
haproxy
icinga
iis
kafka
kibana
logstash
mongodb
mysql
nginx
osquery
postgresql
redis
suricata
system
traefik
启动某一 module
./filebeat modules enable redis #启动
./filebeat modules disable redis #禁用
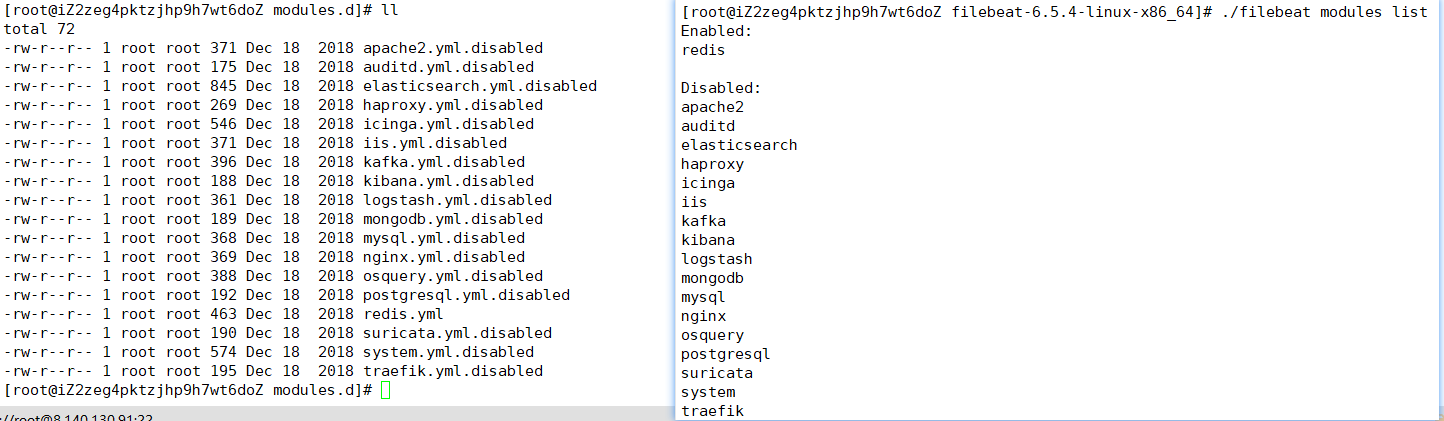
可见,启动某一
module就是将filebeat-6.5.4-linux-x86_64/modules.d/下的对应yml去掉disabled
redis module
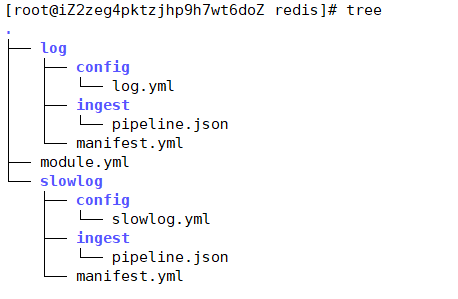
- log:日志
- slowlog:慢查询日志
redis module 配置
- module: redis# Main logslog:enabled: true# Set custom paths for the log files. If left empty,# Filebeat will choose the paths depending on your OS.#var.paths: ["/var/log/redis/redis-server.log*"]# Slow logs, retrieved via the Redis API (SLOWLOG)slowlog:enabled: true# The Redis hosts to connect to.#var.hosts: ["localhost:6379"]# Optional, the password to use when connecting to Redis.#var.password:
修改redis的docker容器
redis 默认情况下,是不会输出日志的,需要自行配置
docker create --name redis-node01 --net host -v /data/redis-data/node01:/data redis --cluster-enabled yes --cluster-announce-ip 8.140.130.91 --cluster-announce-bus-port 16379 --cluster-config-file nodes-node-01.conf --port 6379 --loglevel debug --logfile nodes-node-01.logdocker create --name redis-node02 --net host -v /data/redis-data/node02:/data redis --cluster-enabled yes --cluster-announce-ip 8.140.130.91 --cluster-announce-bus-port 16380 --cluster-config-file nodes-node-02.conf --port 6380 --loglevel debug --logfile nodes-node-02.logdocker create --name redis-node03 --net host -v /data/redis-data/node03:/data redis --cluster-enabled yes --cluster-announce-ip 8.140.130.91 --cluster-announce-bus-port 16381 --cluster-config-file nodes-node-03.conf --port 6381 --loglevel debug --logfile nodes-node-03.log
loglevel 日志等级分为:debug、verbose、notice、warning
- debug 会有大量信息,对开发、测试有用;
- verbose 等于log4j 中的info,有很多信息,但是不会像debug那样乱;
- notice 一般信息;
- warning 只有非常重要/关键的消息被记录
配置filebeat
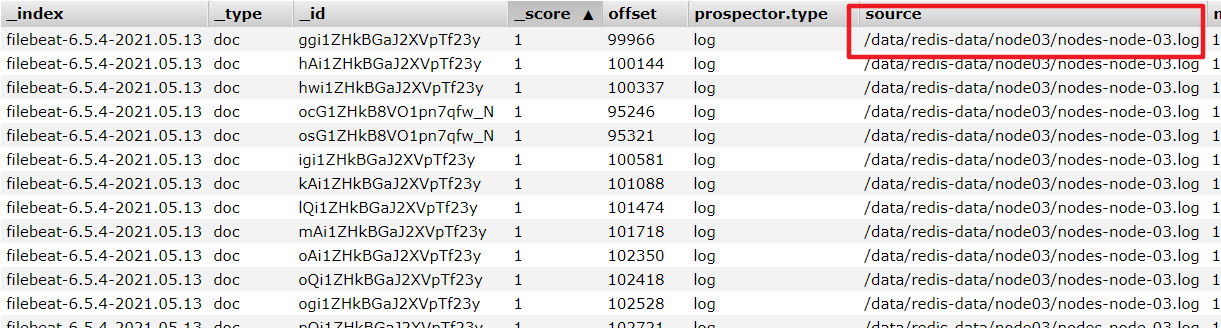
cd /haoke/beats/filebeat-6.5.4-linux-x86_64/modules.d/- module: redis# Main logslog:enabled: true# Set custom paths for the log files. If left empty,# Filebeat will choose the paths depending on your OS.var.paths: ["/data/redis-data/node01/*.log","/data/redis-data/node02/*.log","/data/redis-data/node03/*.log"]# Slow logs, retrieved via the Redis API (SLOWLOG)slowlog:enabled: false# The Redis hosts to connect to.#var.hosts: ["localhost:6379"]# Optional, the password to use when connecting to Redis.#var.password:
vim haoke-redis.ymlfilebeat.inputs:
- type: logenabled: truepaths: - /data/redis-data/*.log
filebeat.config.modules: #获取到所有生效module的配置path: ${path.config}/modules.d/*ymlreload.enabled: false
output.elasticsearch: #指定ES配置hosts: ["8.140.130.91:9200","8.140.130.91:9201","8.140.130.91:9202"]
# es分片数
setup.template.settings:index.number_of_shards: 3# 指定索引的分区数
启动测试
./filebeat -e -c haoke-redis.yml --modules redis
其他Module用法
Modules | Filebeat Reference 7.12] | Elastic
Metricbeat

- 定期收集OS或应用服务的指标数据
- 存储到Elasticsearch中,进行实时分析
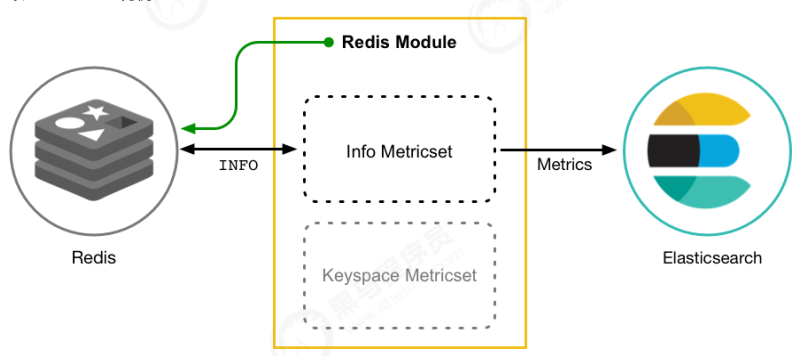
Metricbeat组成
-
Module
收集的对象,如:mysql、redis、操作系统等
-
Metricset
收集指标的集合,如:cpu,memory,network
以RedisModule为例:
部署与收集系统指标
tar -xvf metricbeat-6.5.4-linux-x86_64.tar.gz
cd /haoke/beats/metricbeat-6.5.4-linux-x86_64
vim metricbeat.yml---
metricbeat.config.modules:path: ${path.config}/modules.d/*.ymlreload.enabled: false
setup.template.settings:index.number_of_shards: 3index.codec: best_compression
setup.kibana:
output.elasticsearch:hosts: ["8.140.130.91:9200","8.140.130.91:9201","8.140.130.91:9202"]
processors:- add_host_metadata: ~- add_cloud_metadata: ~
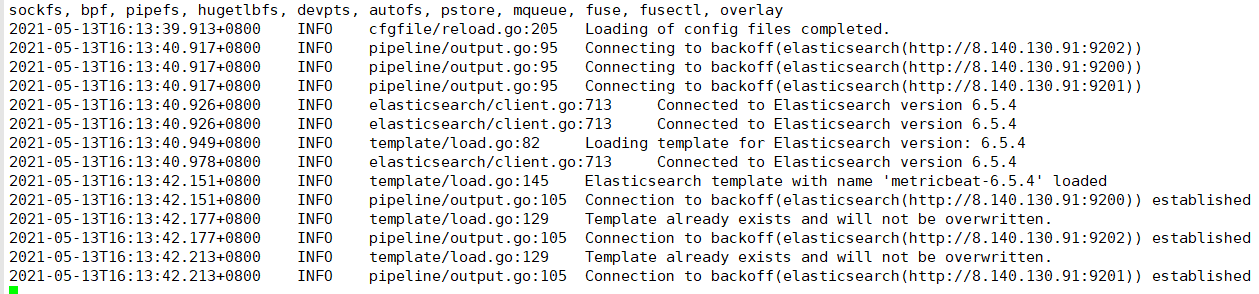
--- # 启动
./metricbeat -e -c metricbeat-log.yml
Module
System module配置
cd /haoke/beats/metricbeat-6.5.4-linux-x86_64/modules.d/
cat system.yml
---
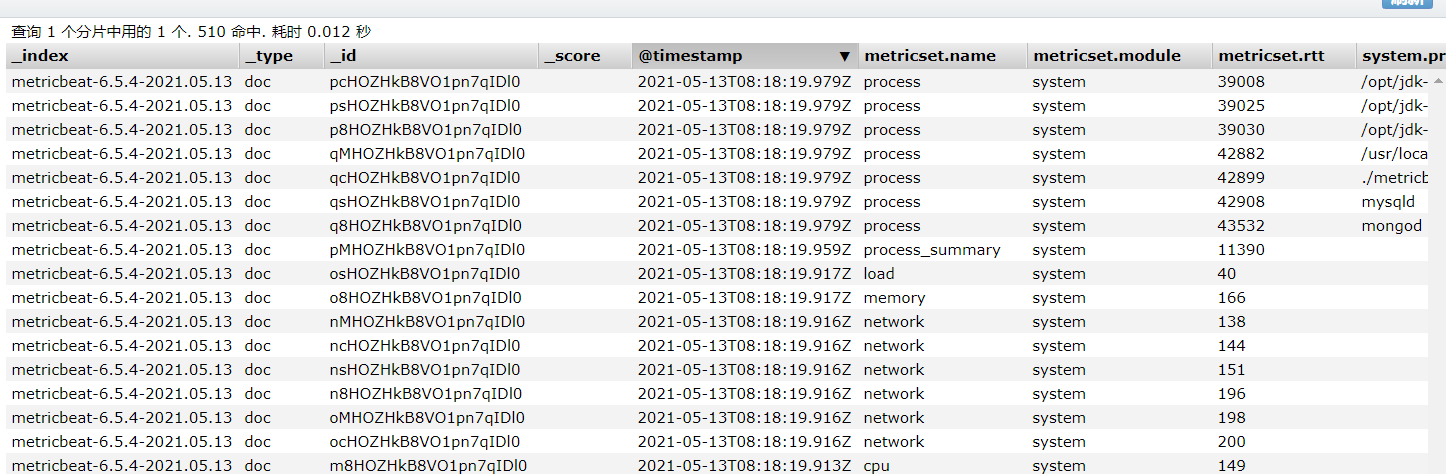
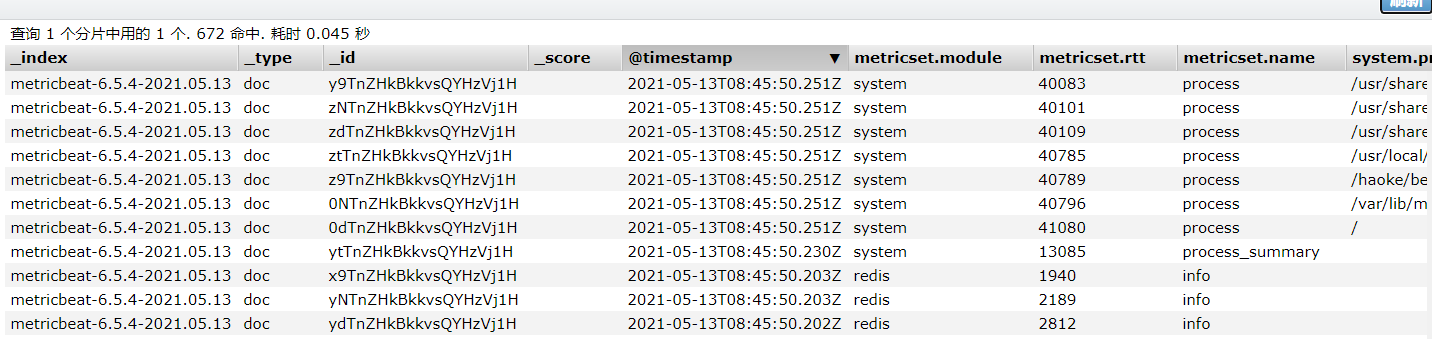
- module: systemperiod: 10smetricsets:- cpu- load- memory- network- process- process_summary#- core#- diskio#- socketprocess.include_top_n:by_cpu: 5 # include top 5 processes by CPUby_memory: 5 # include top 5 processes by memory- module: systemperiod: 1mmetricsets:- filesystem- fsstatprocessors:- drop_event.when.regexp:system.filesystem.mount_point: '^/(sys|cgroup|proc|dev|etc|host|lib)($|/)'- module: systemperiod: 15mmetricsets:- uptime
Redis module
#启用redis module
./metricbeat modules enable redis#修改redis module配置
vim modules.d/redis.yml- module: redismetricsets:- info# - keyspaceperiod: 10s# Redis hostshosts: ["8.140.130.91:6379","8.140.130.91:6380","8.140.130.91:6381"]# Network type to be used for redis connection. Default: tcp#network: tcp# Max number of concurrent connections. Default: 10#maxconn: 10# Redis AUTH password. Empty by default.#password: foobared#启动
./metricbeat -e -c metricbeat-log.yml

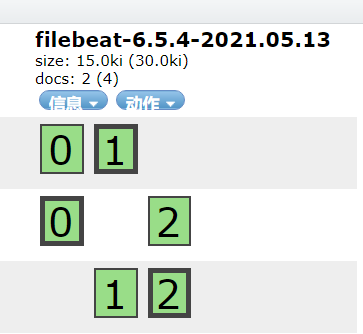
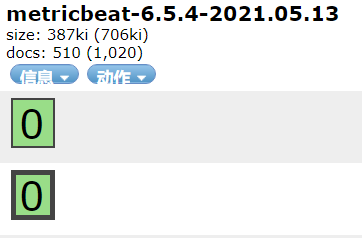
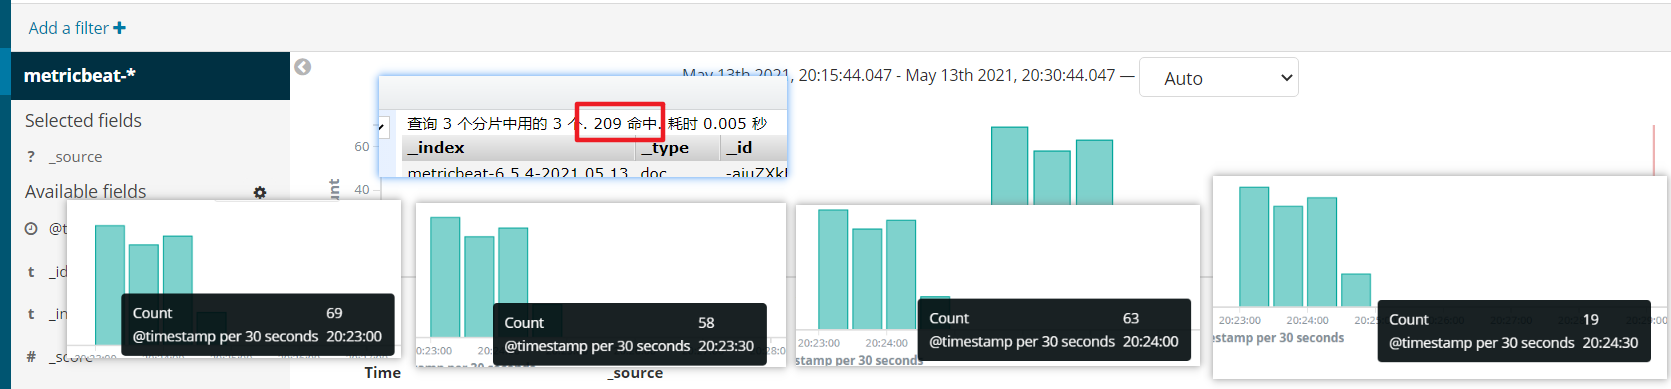
{"_index": "metricbeat-6.5.4-2021.05.13","_type": "doc","_id": "J1g4ZXkBkeBjvVA0_VG6","_version": 1,"_score": null,"_source": {"@timestamp": "2021-05-13T10:15:03.364Z","metricset": {"rtt": 1457,"name": "info","module": "redis","host": "8.140.130.91:6380"},"redis": {"info": {"replication": { "master": { "second_offset": -1,"sync": { },"offset": 0},"slave": { },"role": "master","connected_slaves": 0,"master_offset": 0,"backlog": { "size": 1048576,"first_byte_offset": 0,"histlen": 0,"active": 0}},"clients": {"blocked": 0,"connected": 1,"longest_output_list": 0,"biggest_input_buf": 640,"max_output_buffer": 0,"max_input_buffer": 640},"memory": {"allocator": "jemalloc-5.1.0","allocator_stats": {"active": 2015232,"resident": 4378624,"fragmentation": {"ratio": 1.2,"bytes": 333592},"rss": {"bytes": 2363392,"ratio": 2.17},"allocated": 1681640},"used": {"value": 1563848,"rss": 10366976,"peak": 1563848,"lua": 37888,"dataset": 89872},"max": {"value": 0,"policy": "noeviction"},"fragmentation": {"ratio": 6.91,"bytes": 8866880},"active_defrag": {"is_running": false}},"server": {"tcp_port": 6380,"run_id": "1e6ccdcae239a1835b190a10f9e367e8801542c5","git_sha1": "00000000","mode": "cluster","gcc_version": "8.3.0","lru_clock": 10288167,"arch_bits": "64","process_id": 1,"version": "6.2.1","hz": 10,"uptime": 4175,"config_file": "","os": "Linux 4.18.0-240.15.1.el8_3.x86_64 x86_64","build_id": "3699ff74f0200394","git_dirty": "0","multiplexing_api": "epoll"},"stats": {"connections": {"received": 21,"rejected": 0},"migrate_cached_sockets": 0,"sync": {"full": 0,"partial": {"err": 0,"ok": 0}},"keyspace": {"misses": 0,"hits": 0},"slave_expires_tracked_keys": 0,"instantaneous": {"output_kbps": 0,"ops_per_sec": 0,"input_kbps": 0},"active_defrag": {"hits": 0,"misses": 0,"key_hits": 0,"key_misses": 0},"commands_processed": 32,"keys": {"expired": 0,"evicted": 0},"latest_fork_usec": 0,"net": {"output": {"bytes": 65358},"input": {"bytes": 1414}},"pubsub": {"patterns": 0,"channels": 0}},"slowlog": {"count": 1},"cluster": {"enabled": true},"cpu": {"used": {"user_children": 0.002411,"sys": 7.740379,"user": 7.258026,"sys_children": 0.000598}},"persistence": {"aof": {"write": {"last_status": "ok"},"copy_on_write": {"last_size": 0},"buffer": { },"size": { },"fsync": { },"enabled": false,"rewrite": {"buffer": { },"in_progress": false,"scheduled": false,"last_time": {"sec": -1},"current_time": {"sec": -1}},"bgrewrite": {"last_status": "ok"}},"loading": false,"rdb": {"copy_on_write": {"last_size": 0},"last_save": {"changes_since": 0,"time": 1620896728},"bgsave": {"last_time": {"sec": -1},"current_time": {"sec": -1},"last_status": "ok","in_progress": false}}}}},"beat": {"version": "6.5.4","name": "iZ2zeg4pktzjhp9h7wt6doZ","hostname": "iZ2zeg4pktzjhp9h7wt6doZ"},"host": {"architecture": "x86_64","os": {"platform": "centos","version": "8","family": "redhat"},"id": "20200218155604663518171520219378","containerized": false,"name": "iZ2zeg4pktzjhp9h7wt6doZ"},"meta": {"cloud": {"instance_id": "i-2zeg4pktzjhp9h7wt6do","region": "cn-beijing","availability_zone": "cn-beijing-h","provider": "ecs"}}},"sort": [1620900903364]
}
Kibana——可视化
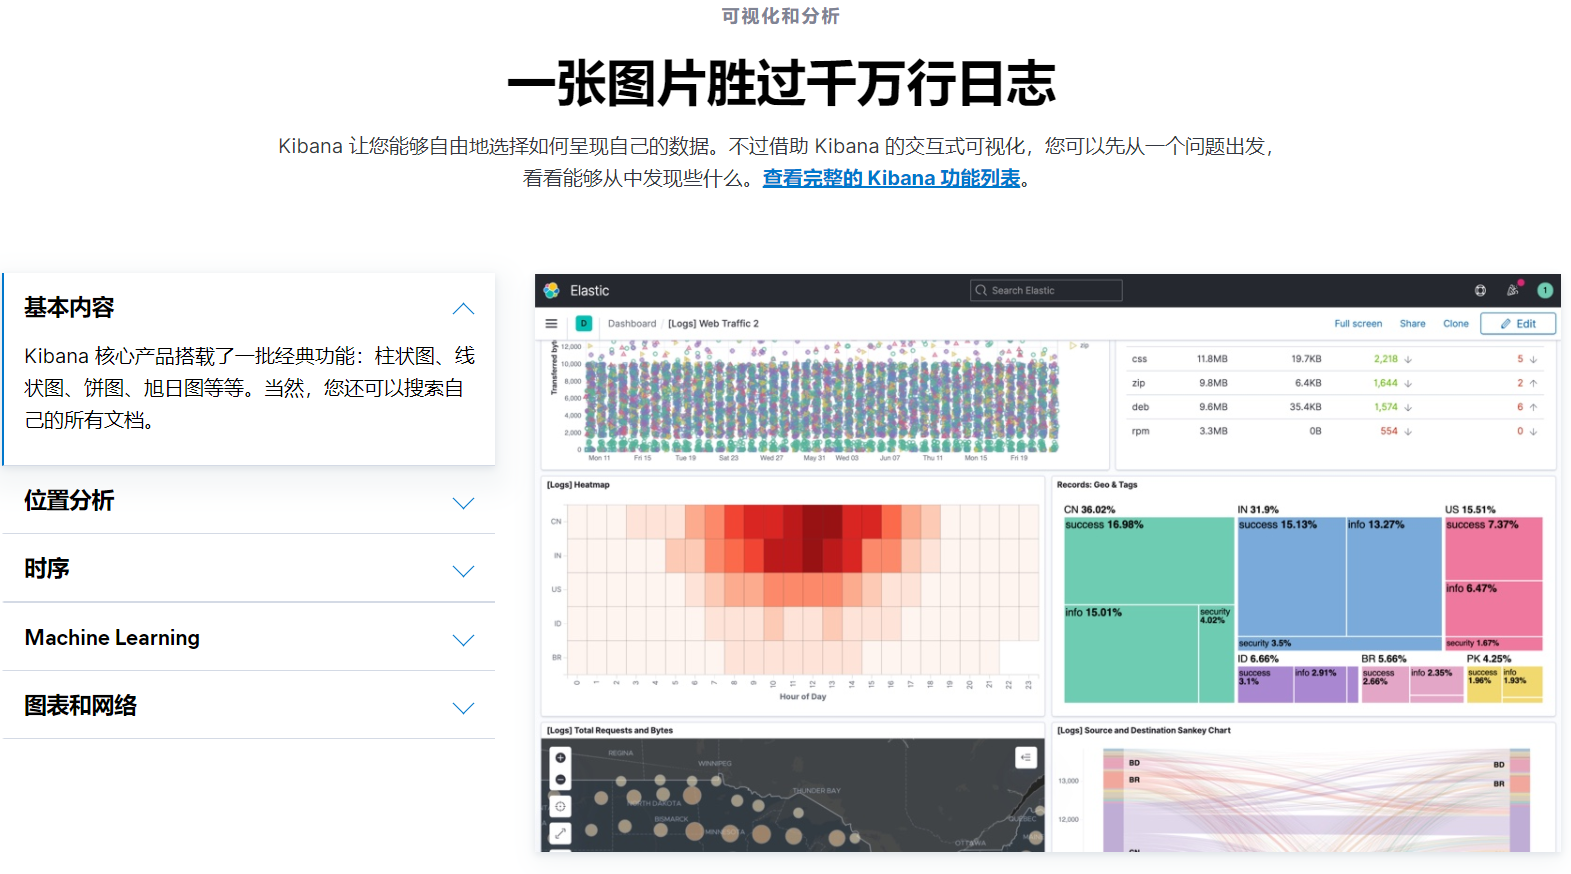
Kibana:数据的探索、可视化和分析 | Elastic
docker 部署kibana
docker pull kibana:6.5.4# 创建配置文件
cd /haoke/kibana-docker
vim kibana.yml
---
server.host: "8.140.130.91"
elasticsearch.url: "http://8.140.130.91:9200"
---#创建容器
docker create --name kibana --net host -v /haoke/kibana-docker/kibana.yml:/usr/share/kibana/config/kibana.yml kibana:6.5.4docker start kibana
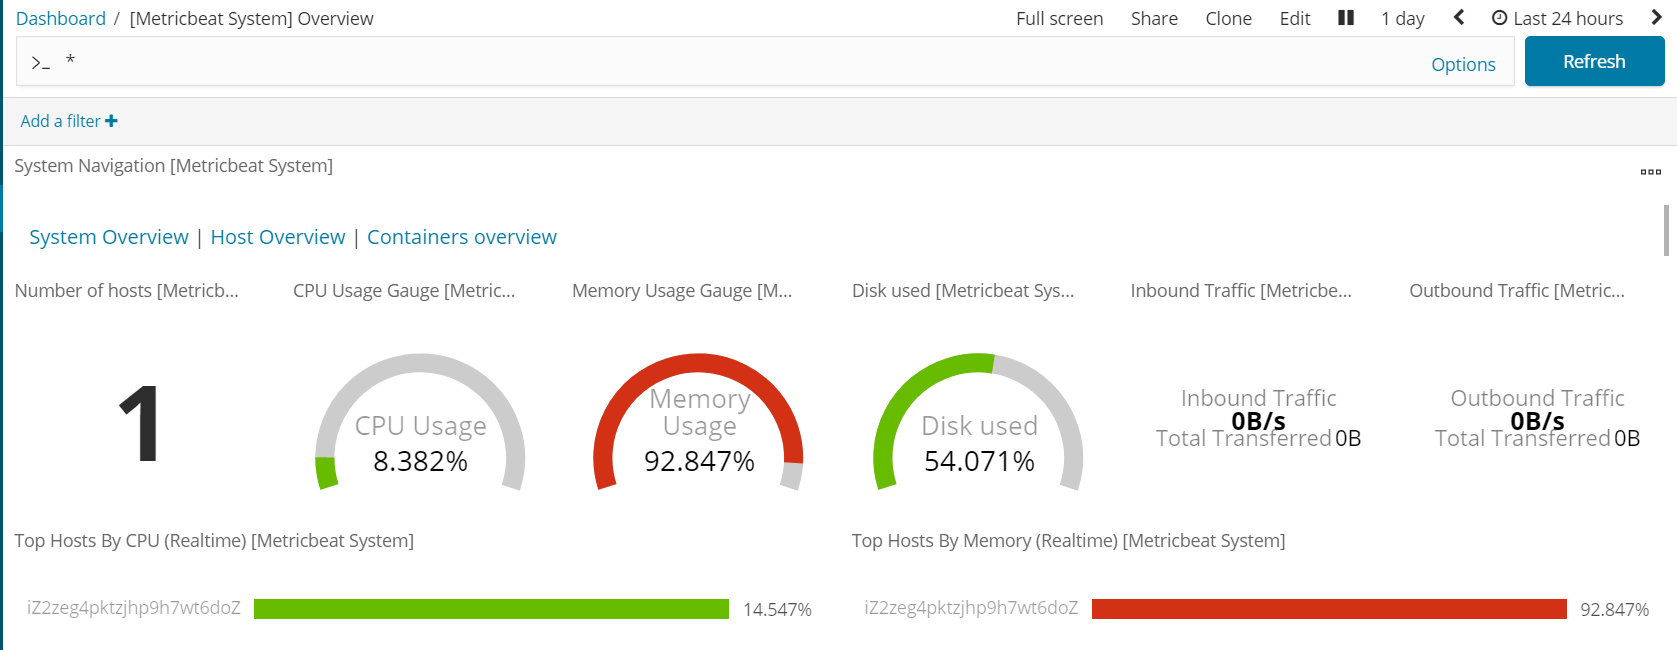
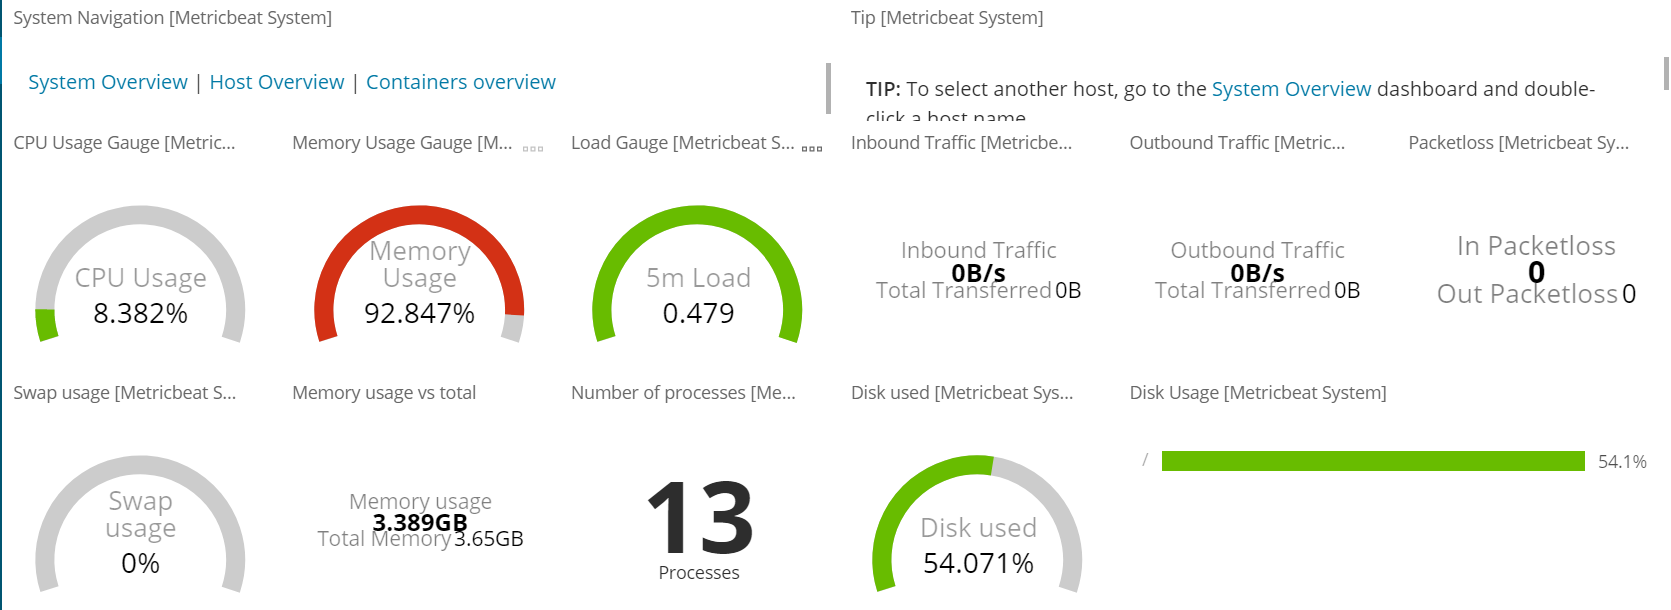
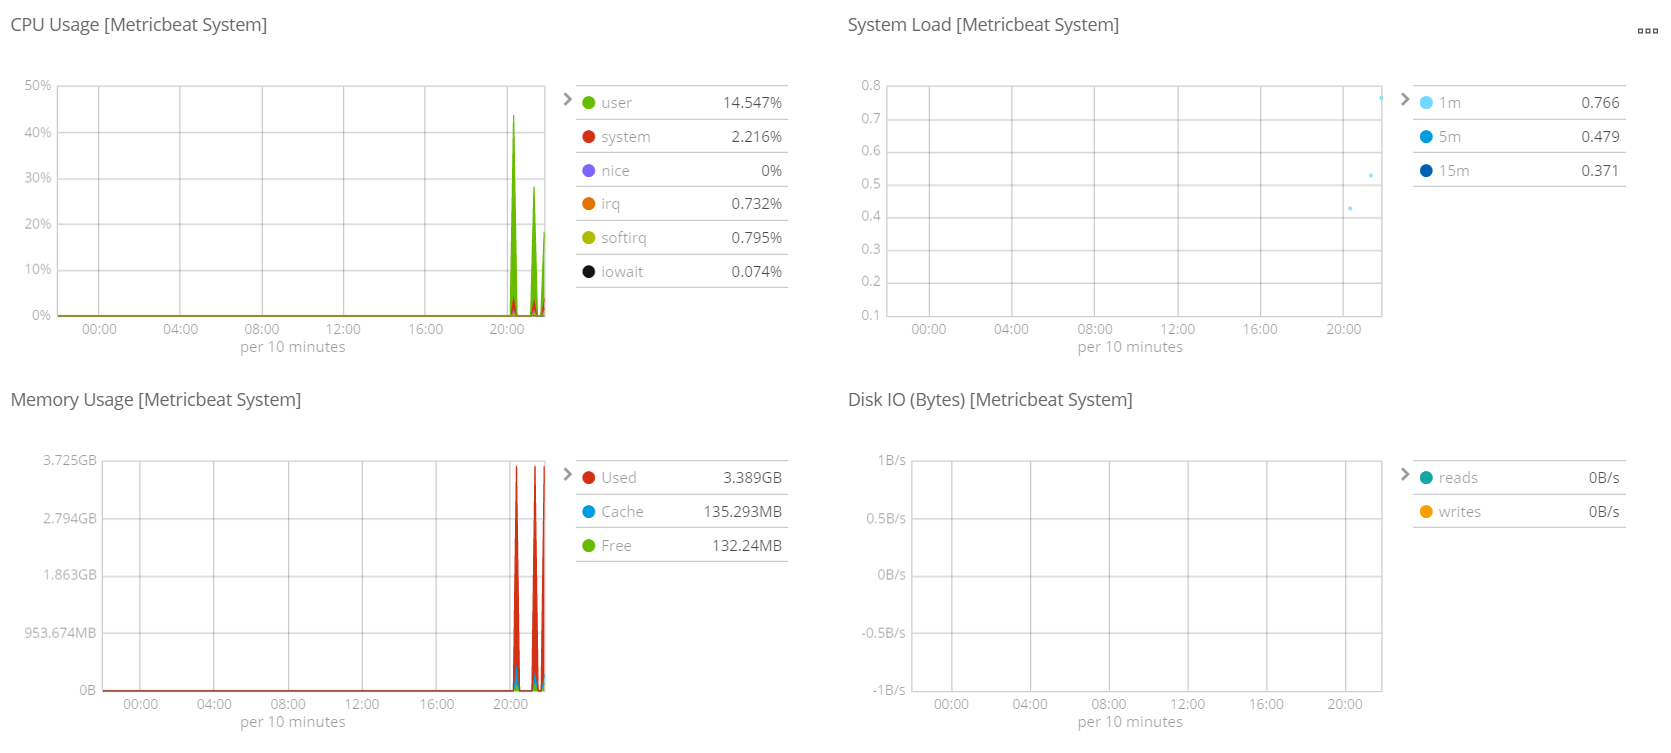
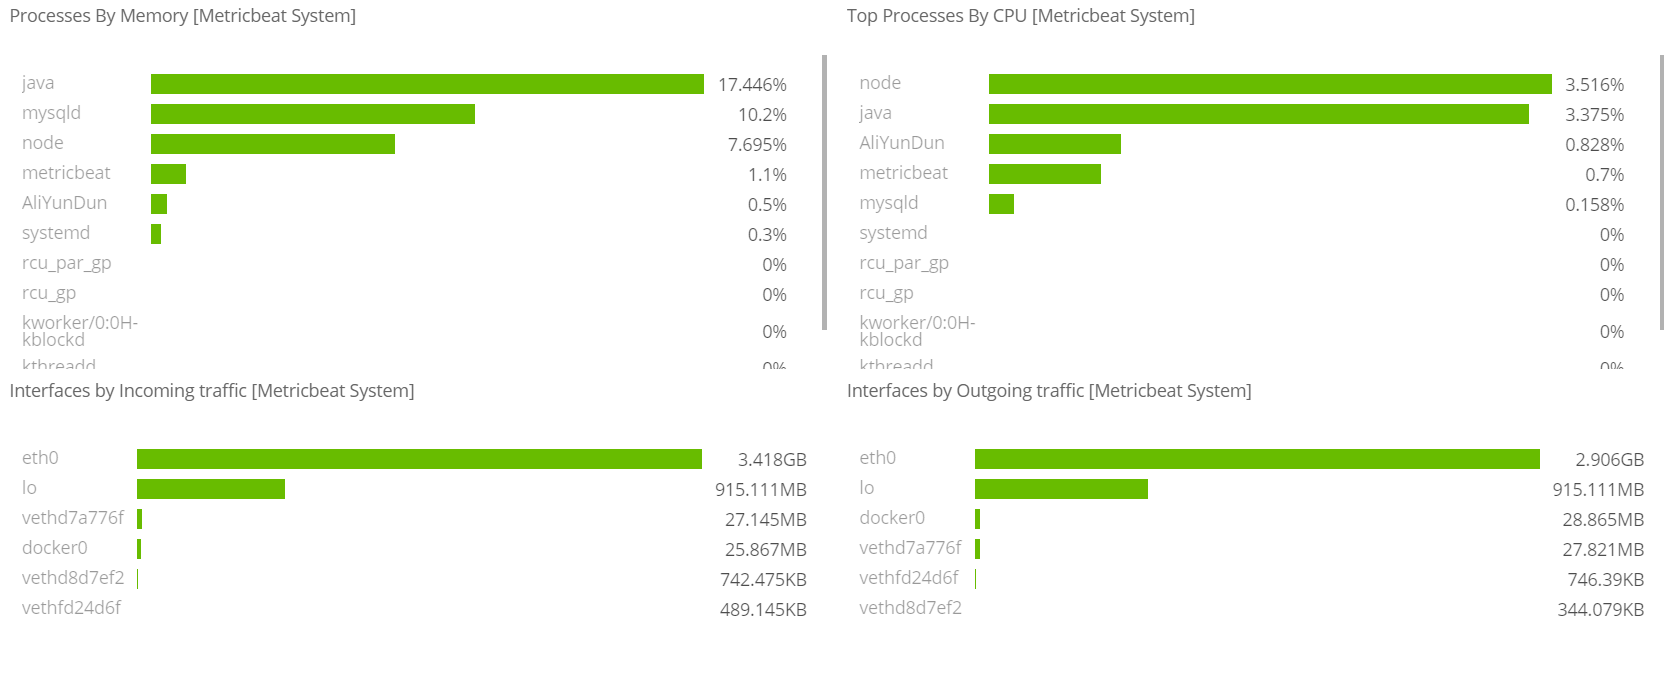
Metricbeat仪表盘
# 修改metricbeat.yml配置
metricbeat.config.modules:path: ${path.config}/modules.d/*.ymlreload.enabled: false
setup.template.settings:index.number_of_shards: 3index.codec: best_compression
setup.kibana:
output.elasticsearch:hosts: ["8.140.130.91:9200","8.140.130.91:9201","8.140.130.91:9202"]
processors:- add_host_metadata: ~- add_cloud_metadata: ~
setup.kibana:host: "8.140.130.91:5601"---# 安装仪表盘到kibana
./metricbeat setup --dashboards

Filebeat仪表盘
#修改 filebeat.yml 配置文件
filebeat.inputs:
- type: logenabled: truepaths:- /haoke/logs/*.log
setup.template.settings:index.number_of_shards: 3
filebeat.config.modules:path: ${path.config}/modules.d/*.ymlreload.enabled: falseoutput.elasticsearch:hosts: ["8.140.130.91:9200","8.140.130.91:9201","8.140.130.91:9202"]setup.kibana:host: "8.140.130.91:5601"#安装仪表盘到kibana
./filebeat -c haoke-redis.yml setup
日志太大 就不做测试
Logstash
部署安装

# 检查jdk环境,要求1.8+
java -version#解压安装包
tar -xvf logstash-6.5.4.tar.gz#第一个logstash示例
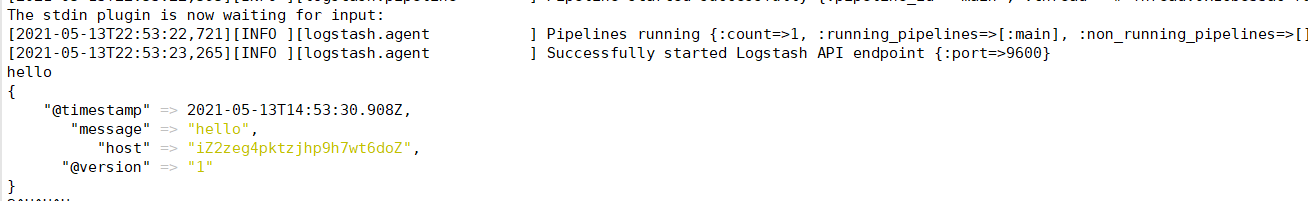
bin/logstash -e 'input {stdin{ } } output { stdout{ } }'
接收Filebeat输入的日志
将
Filebeat和Logstash整合起来,读取nginx的日志
Nginx生成日志文件
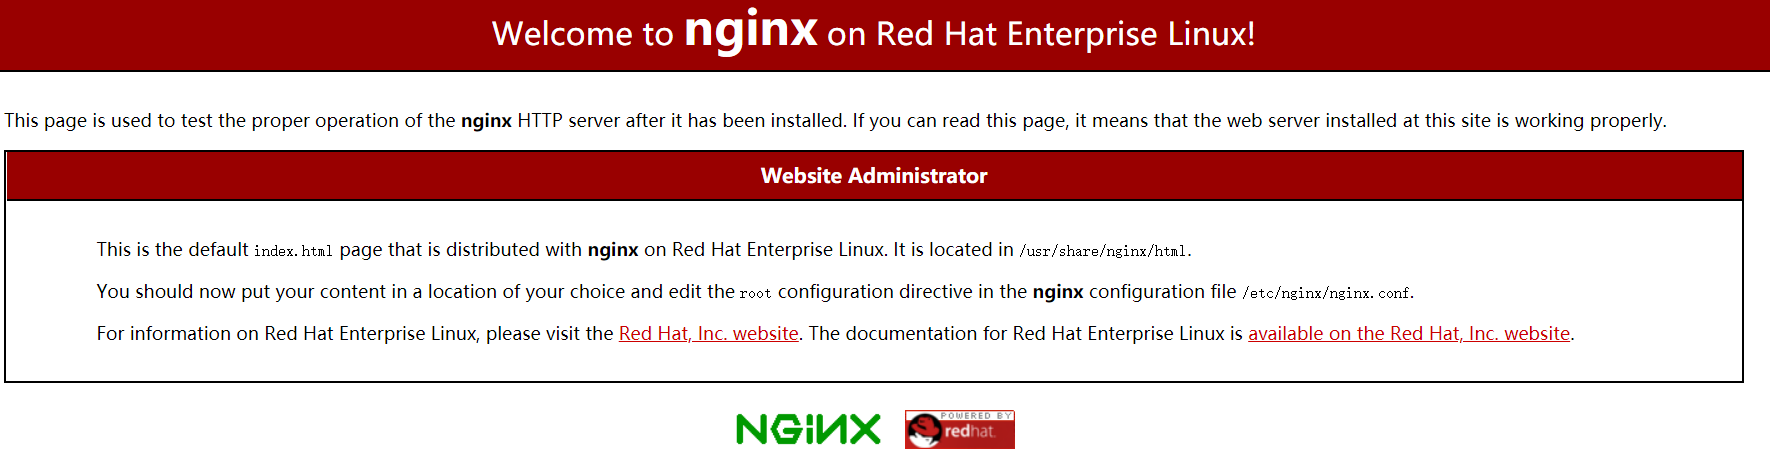
安装Nginx
apt install nginx -y
#/usr/sbin/nginx:主程序
#/etc/nginx:存放配置文件
#/usr/share/nginx:存放静态文件
#/var/log/nginx:存放日志# nginx 服务命令
service nginx {start|stop|restart|reload|forcereload|status|configtest|rotate|upgrade}# 通过浏览器访问页面并查看日志
# 访问地址:http://8.140.130.91
tail -f /var/log/nginx/access.log
Filebeat向Logstash发送日志
配置Logstash——logstash处理日志
cd /haoke/logstash
vim haoke-pipeline.conf---
input {beats {port => "5044"}
}
#The filter part of this file is commented out to indicate that it is
# optional.
# filter {
#
#}
output {stdout { codec => rubydebug }
}
---# 启动 --config.test_and_exit 用于测试配置文件是否正确
bin/logstash -f haoke-pipeline.conf --config.test_and_exit#Sending Logstash logs to /haoke/logstash-6.5.4/logs which is now configured via log4j2.properties
#[2021-05-14T09:23:53,124][WARN ][logstash.config.source.multilocal] Ignoring the 'pipelines.yml' file because modules or command line options are specified
#Configuration OK
#[2021-05-14T09:23:55,508][INFO ][logstash.runner          ] Using config.test_and_exit mode. Config Validation Result: OK. Exiting Logstash
配置 Filebeat——读取nginx日志
# cd /haoke
# vim haoke-nginx.ymlfilebeat.inputs:
- type: logenabled: truepaths:- /var/log/nginx/access.logtags: ["log"]fields:from: nginxfields_under_root: false
output.logstash:hosts: ["8.140.130.91:5044"]#启动
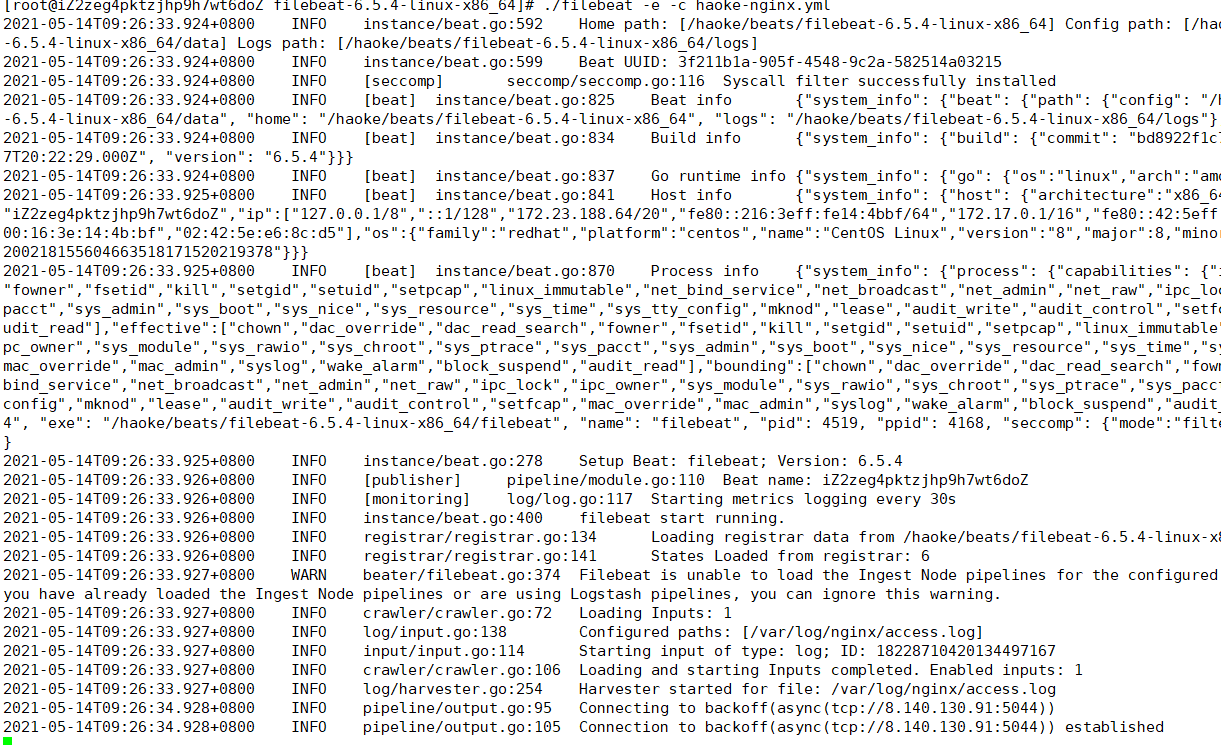
./filebeat -e -c haoke-nginx.yml
#说明:现在启动会报错,因为Logstash还没有启动
测试
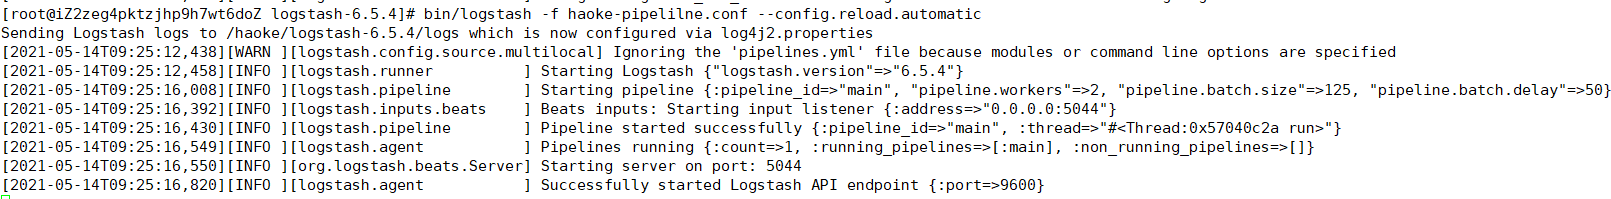
#正式启动 --config.reload.automatic 热加载配置文件,修改配置文件后无需重新启动
bin/logstash -f haoke-pipeline.conf --config.reload.automatic
#启动 filebeat 采集nginx日志数据
./filebeat -e -c haoke-nginx.yml
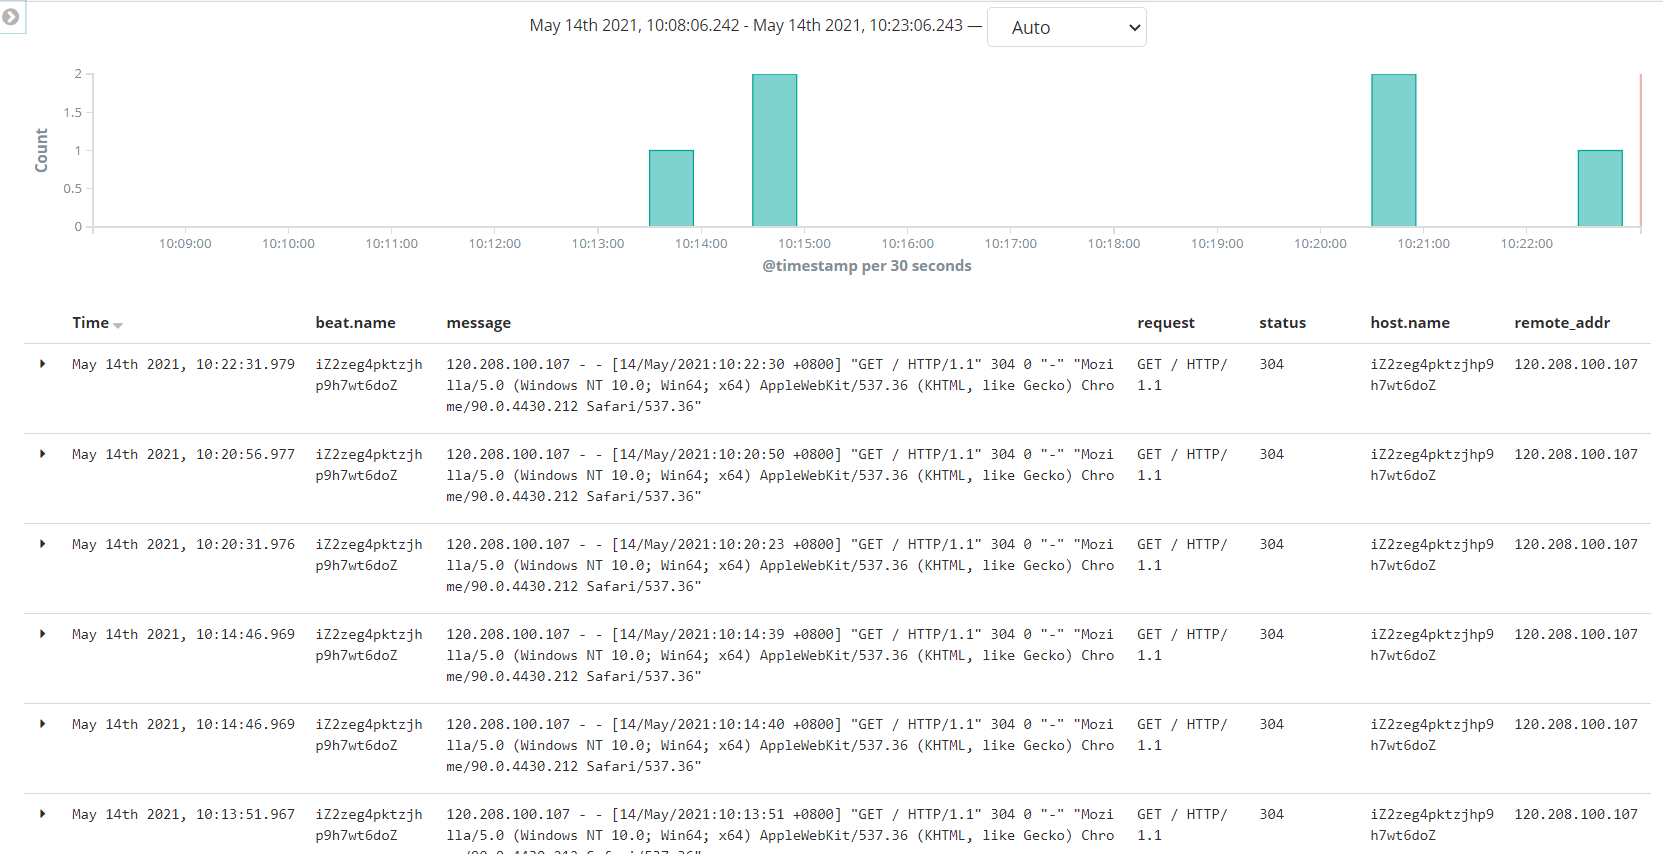
刷新页面
查看输出
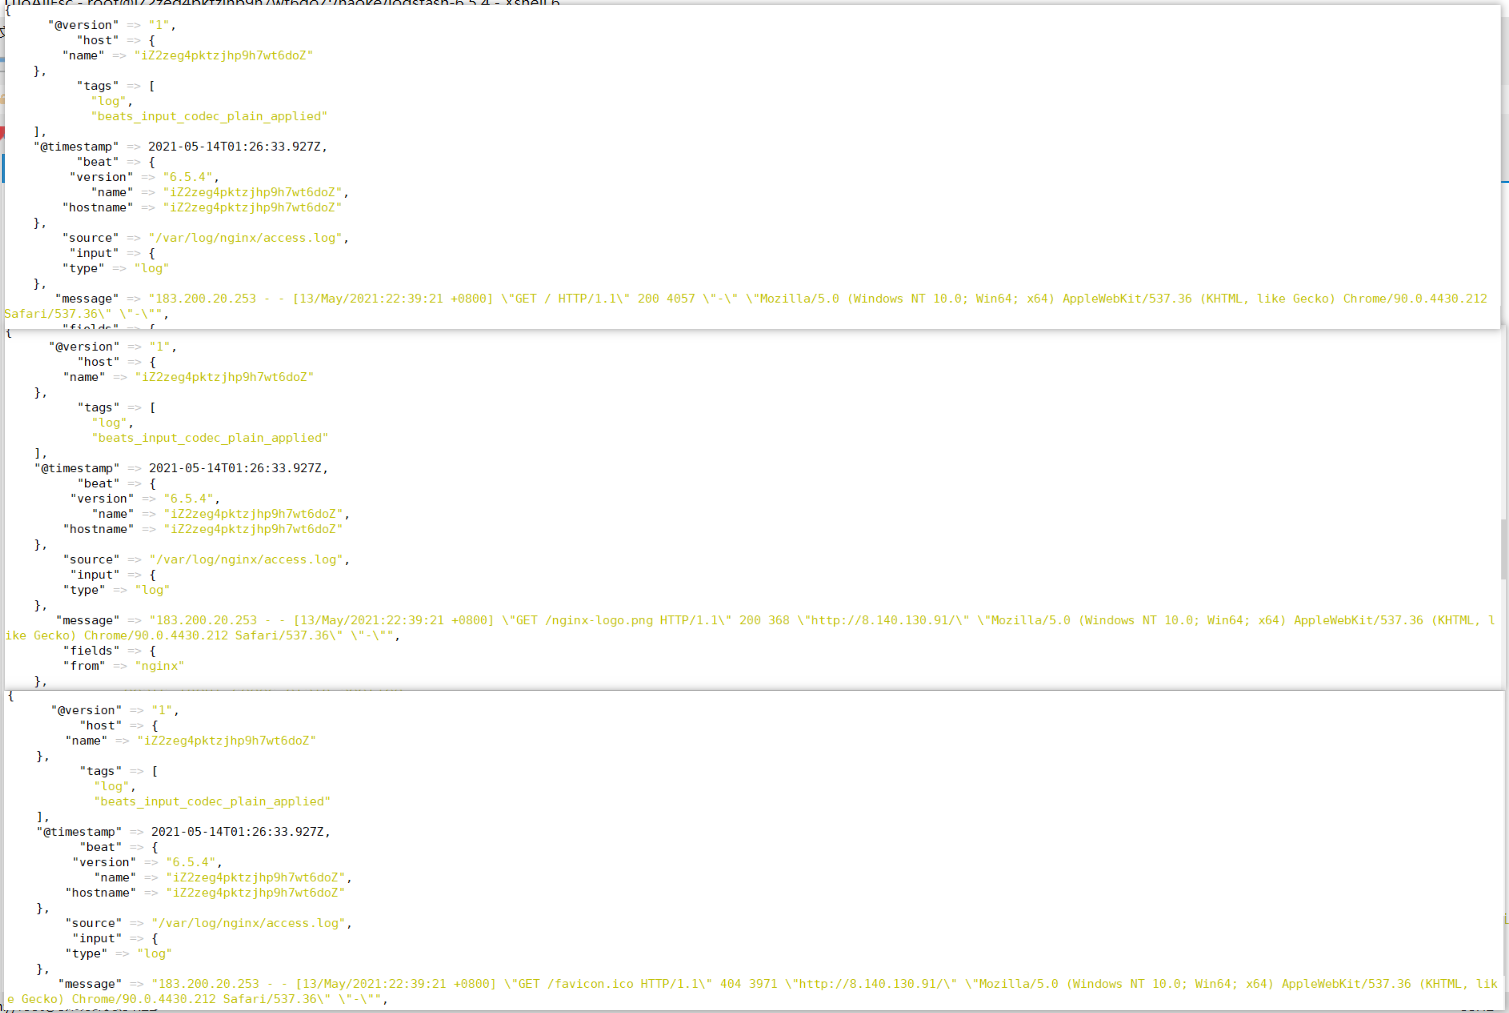
配置filter
未经处理的信息格式很不友好
自定义nginx日志格式
vim /etc/nginx/nginx.conf
---log_format  main  '$remote_addr - $remote_user [$time_local] ''"$request" $status $body_bytes_sent'' "$http_referer" "$http_user_agent" ';access_log  /var/log/nginx/access.log  main;
---nginx -s reload
出现以下问题:Redirecting to /bin/systemctl start nginx.service
解决:安装 iptables
yum install iptables-services
编写nginx-patterns 文件
cd /haoke/logstash-6.5.4vim nginx-patterns
---
NGINX_ACCESS %{IPORHOST:remote_addr} - %{USERNAME:remote_user} \\[%{HTTPDATE:time_local}\\] \\"%{DATA:request}\\" %{INT:status} %{NUMBER:bytes_sent} \\"%{DATA:http_referer}\\" \\"%{DATA:http_user_agent}\\"
---
修改 haoke-pipeline.conf
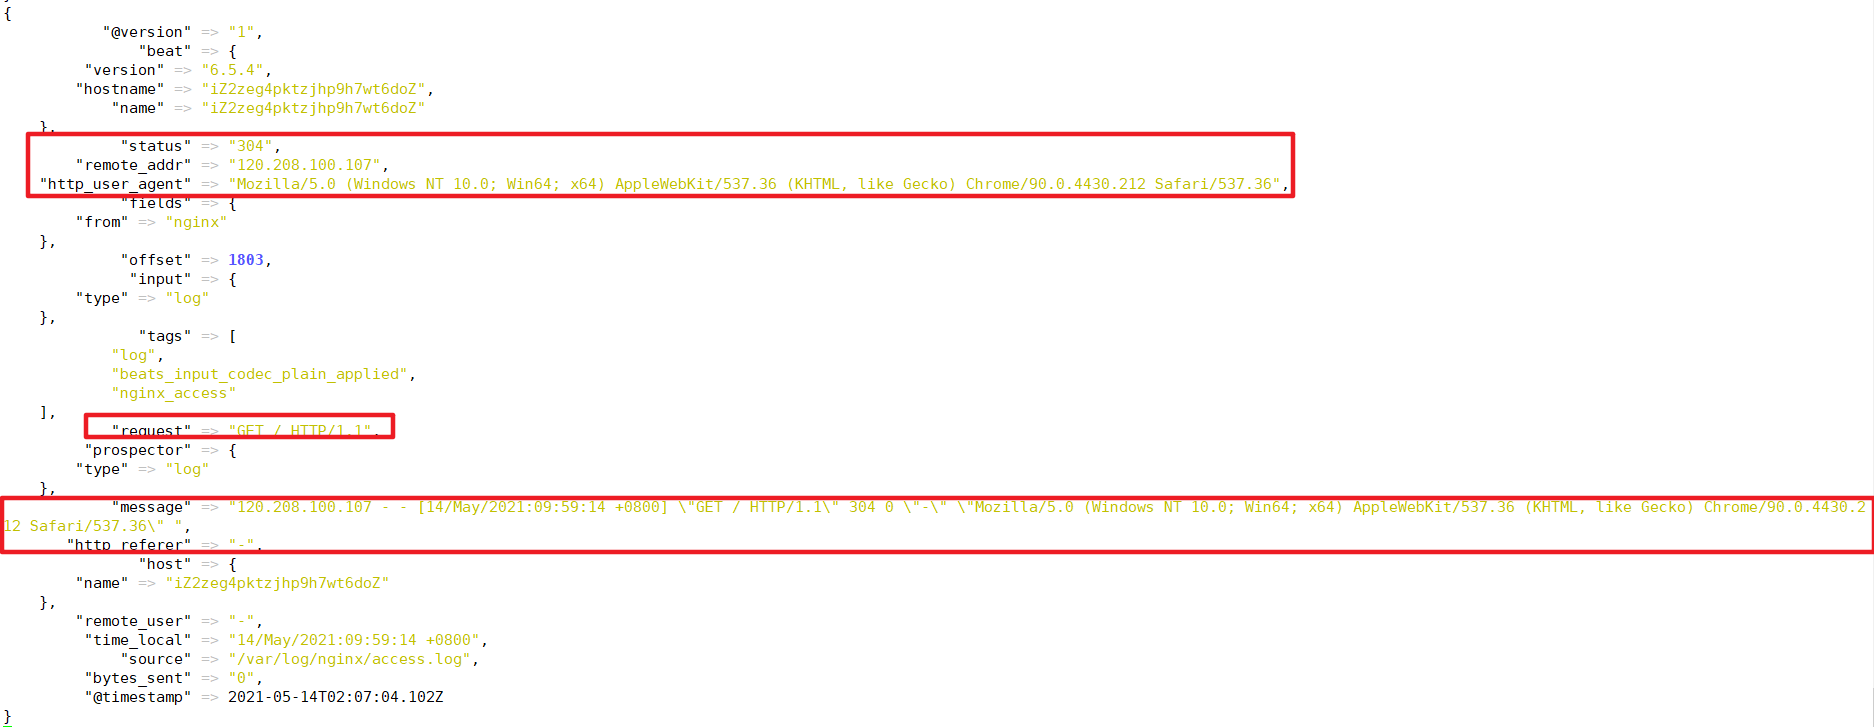
input {beats {port => "5044"}
} filter {grok {patterns_dir => "/haoke/logstash-6.5.4/nginx-patterns"match => { "message" => "%{NGINX_ACCESS}"}remove_tag => [ "_grokparsefailure" ]add_tag => [ "nginx_access" ]}
} output {stdout { codec => rubydebug }
}
测试
bin/logstash -f haoke-pipeline.conf --config.reload.automatic
./filebeat -e -c haoke-nginx.yml
Logstash 向ES发送数据
input{beats{port => "5044"}}filter {grok {patterns_dir => "/haoke/logstash-6.5.4/nginx-patterns"match => { "message" => "%{NGINX_ACCESS}"}remove_tag => [ "_grokparsefailure" ]add_tag => [ "nginx_access" ]}
}#output{
#       stdout{
#               codec => rubydebug
#       }
#}output {elasticsearch {hosts => [ "8.140.130.91:9200","8.140.130.91:9201","8.140.130.91:9202" ]}
}
由于是 logstash 是热启动,修改配置文件后自动重载

启动filebeat 采集 nginx日志数据