基于python的奥运会历史数据分析【120年】

人生苦短 我用Python

Python其他实用资料:点击此处跳转文末名片获取
一、数据概览
1.背景描述
该数据集整理了从1896年雅典奥运会至2016年里约热内卢奥运会120年的奥林匹克运动会的历史数据。
需要注意的是,在1896年-1992年期间,冬季奥运会与夏季奥运会都是在同一年举行的。在这之后,冬季与夏季的奥运会才被错开举办,冬季奥运会从1994年开始4年举办一次,夏季奥运会从1996开始4年举办一次。大家在分析这些数据时,经常会犯得一个错误就是认为夏季与冬季奥运会是一直错开举办的。
-
受疫情影响,2020东京奥运会将延期至2021年举行;
-
虽然延期,但此次奥运会依旧会沿用「2020东京奥运会」这个名称;
-
这也将是奥运会历史上首次延期(1916年、1940年、1944年曾因一战,二战停办);
2.数据说明
-
文件列表 该数据集包含两个文件:
-
athlete_events.csv :参赛运动员基本生物数据和奖牌结果
-
noc_regions.csv : 国家奥委会3个字母的代码与对应国家信息
3.属性描述
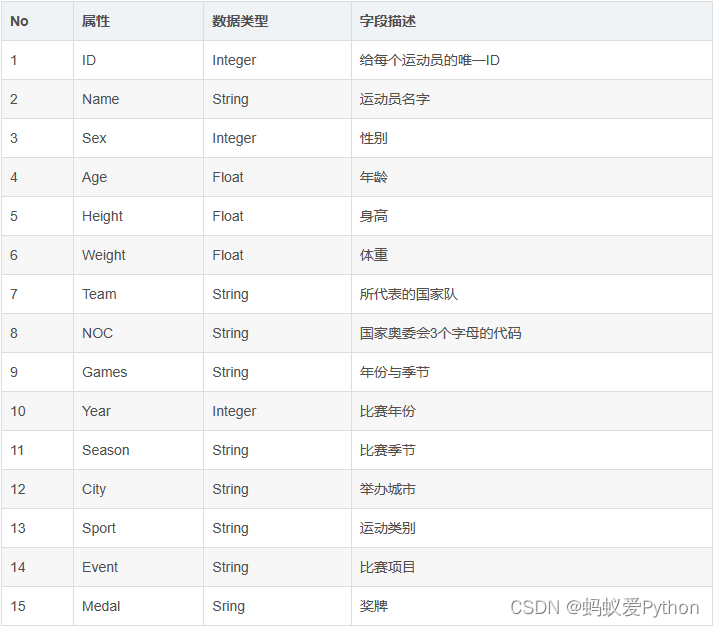
文件athlete_events.csv中包含15个字段,具体信息如下:
每一行代表的是一个参加个人比赛运动员
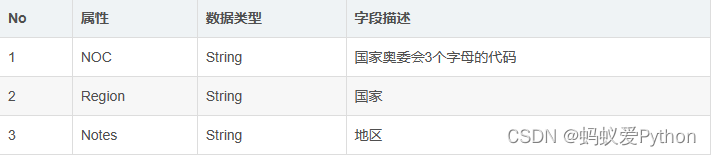
文件noc_regions.csv中包含3个字段,具体信息如下:
4.数据来源
数据集源自于kaggle平台用户分享,
基于证书 CC0: Public Domain 发布,
具体信息内容源自
https://www.sports-reference.com/

二、数据集可探索、研究的方向
可以从以下几个方面来探索奥林匹克运动会的演变历程:
-
历年来 男女参赛运动员的表现如何?
-
那不同地区?
-
不同运动项目?
-
不同比赛项目?
三、可视化分析
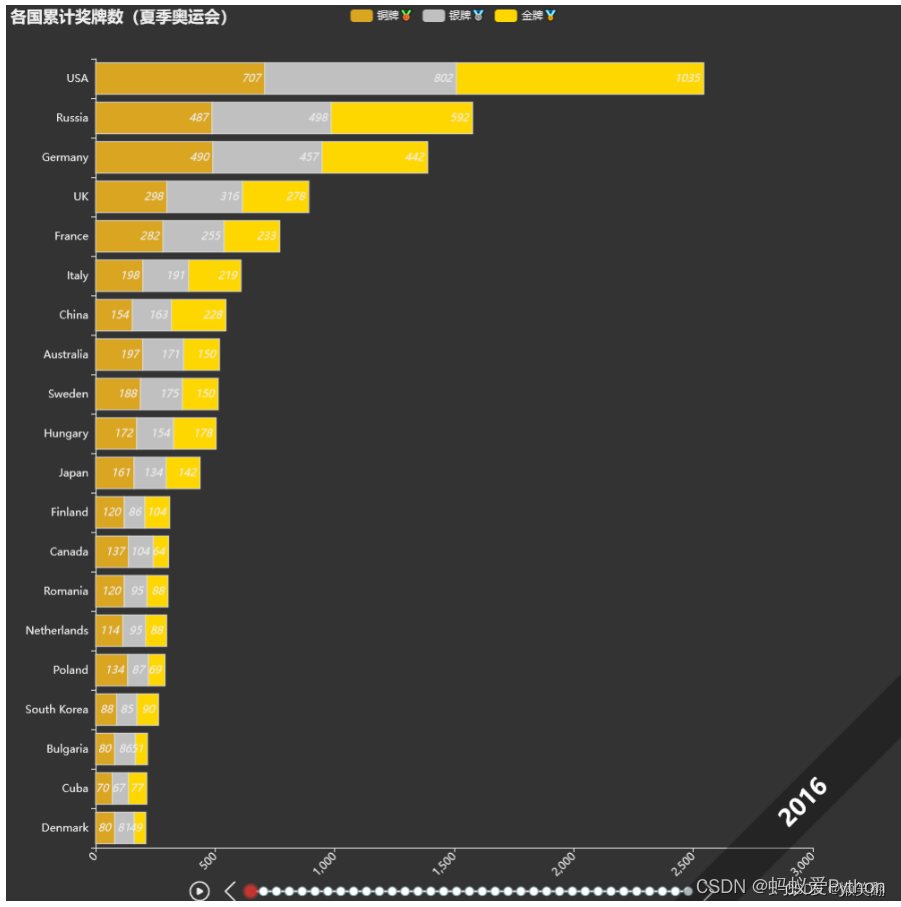
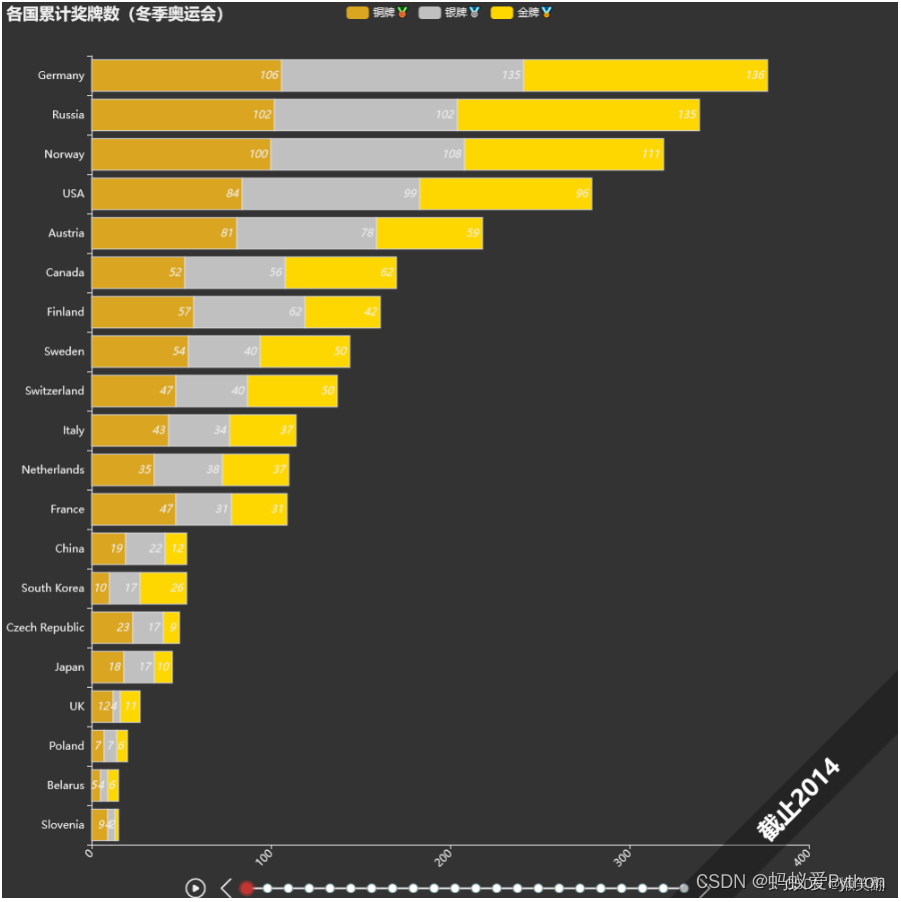
1.🏆各国累计奖牌数
import pandas as pd
from pyecharts.charts import *
from pyecharts import options as opts
from pyecharts.commons.utils import JsCodeathlete_data = pd.read_csv('./data/athlete_events.csv')
noc_region = pd.read_csv('./data/noc_regions.csv')# 关联代表国家
data = pd.merge(athlete_data, noc_region, on='NOC', how='left')
print(data.head())medal_data = data.groupby(['Year', 'Season', 'region', 'Medal'])['Event'].nunique().reset_index()
medal_data.columns = ['Year', 'Season', 'region', 'Medal', 'Nums']
medal_data = medal_data.sort_values(by="Year", ascending=True)def medal_stat(year, season='Summer'):t_data = medal_data[(medal_data['Year'] <= year) & (medal_data['Season'] == season)]t_data = t_data.groupby(['region', 'Medal'])['Nums'].sum().reset_index()t_data = t_data.set_index(['region', 'Medal']).unstack().reset_index().fillna(0, inplace=False)t_data = sorted([(row['region'][0], int(row['Nums']['Gold']), int(row['Nums']['Silver']), int(row['Nums']['Bronze']))for _, row in t_data.iterrows()], key=lambda x: x[1] + x[2] + x[3], reverse=True)[:20]return t_datayear_list = sorted(list(set(medal_data['Year'].to_list())), reverse=True)tl = Timeline(init_opts=opts.InitOpts(theme='dark', width='1000px', height='1000px'))
tl.add_schema(is_timeline_show=True, is_rewind_play=True, is_inverse=False,label_opts=opts.LabelOpts(is_show=False))for year in year_list:t_data = medal_stat(year)[::-1]bar = (Bar(init_opts=opts.InitOpts()).add_xaxis([x[0] for x in t_data]).add_yaxis("铜牌🥉", [x[3] for x in t_data],stack='stack1',itemstyle_opts=opts.ItemStyleOpts(border_color='rgb(220,220,220)', color='rgb(218,165,32)')).add_yaxis("银牌🥈", [x[2] for x in t_data],stack='stack1',itemstyle_opts=opts.ItemStyleOpts(border_color='rgb(220,220,220)', color='rgb(192,192,192)')).add_yaxis("金牌🏅️", [x[1] for x in t_data],stack='stack1',itemstyle_opts=opts.ItemStyleOpts(border_color='rgb(220,220,220)', color='rgb(255,215,0)')).set_series_opts(label_opts=opts.LabelOpts(is_show=True,position='insideRight',font_style='italic'), ).set_global_opts(title_opts=opts.TitleOpts(title="各国累计奖牌数(夏季奥运会)"),xaxis_opts=opts.AxisOpts(axislabel_opts=opts.LabelOpts(rotate=45)),legend_opts=opts.LegendOpts(is_show=True),graphic_opts=[opts.GraphicGroup(graphic_item=opts.GraphicItem(rotation=JsCode("Math.PI / 4"),bounding="raw",right=110,bottom=110,z=100),children=[opts.GraphicRect(graphic_item=opts.GraphicItem(left="center", top="center", z=100),graphic_shape_opts=opts.GraphicShapeOpts(width=400, height=50),graphic_basicstyle_opts=opts.GraphicBasicStyleOpts(fill="rgba(0,0,0,0.3)"),),opts.GraphicText(graphic_item=opts.GraphicItem(left="center", top="center", z=100),graphic_textstyle_opts=opts.GraphicTextStyleOpts(text=year,font="bold 26px Microsoft YaHei",graphic_basicstyle_opts=opts.GraphicBasicStyleOpts(fill="#fff"),),),],)], ).reversal_axis())tl.add(bar, year)tl.render(r".\\htmlRender\\01_各国累计奖牌数(夏季奥运会).html")
import pandas as pd
from pyecharts.charts import *
from pyecharts import options as opts
from pyecharts.commons.utils import JsCodeathlete_data = pd.read_csv('./data/athlete_events.csv')
noc_region = pd.read_csv('./data/noc_regions.csv')# 关联代表国家
data = pd.merge(athlete_data, noc_region, on='NOC', how='left')
print(data.head())medal_data = data.groupby(['Year', 'Season', 'region', 'Medal'])['Event'].nunique().reset_index()
medal_data.columns = ['Year', 'Season', 'region', 'Medal', 'Nums']
medal_data = medal_data.sort_values(by="Year", ascending=True)def medal_stat(year, season='Summer'):t_data = medal_data[(medal_data['Year'] <= year) & (medal_data['Season'] == season)]t_data = t_data.groupby(['region', 'Medal'])['Nums'].sum().reset_index()t_data = t_data.set_index(['region', 'Medal']).unstack().reset_index().fillna(0, inplace=False)t_data = sorted([(row['region'][0], int(row['Nums']['Gold']), int(row['Nums']['Silver']), int(row['Nums']['Bronze']))for _, row in t_data.iterrows()], key=lambda x: x[1] + x[2] + x[3], reverse=True)[:20]return t_datayear_list = sorted(list(set(medal_data['Year'].to_list())), reverse=True)tl = Timeline(init_opts=opts.InitOpts(theme='dark', width='1000px', height='1000px'))
tl.add_schema(is_timeline_show=True, is_rewind_play=True, is_inverse=False,label_opts=opts.LabelOpts(is_show=False))year_list = sorted(list(set(medal_data['Year'][medal_data.Season == 'Winter'].to_list())), reverse=True)tl = Timeline(init_opts=opts.InitOpts(theme='dark', width='1000px', height='1000px'))
tl.add_schema(is_timeline_show=True, is_rewind_play=True, is_inverse=False,label_opts=opts.LabelOpts(is_show=False))for year in year_list:t_data = medal_stat(year, 'Winter')[::-1]bar = (Bar(init_opts=opts.InitOpts(theme='dark')).add_xaxis([x[0] for x in t_data]).add_yaxis("铜牌🥉", [x[3] for x in t_data],stack='stack1',itemstyle_opts=opts.ItemStyleOpts(border_color='rgb(220,220,220)', color='rgb(218,165,32)')).add_yaxis("银牌🥈", [x[2] for x in t_data],stack='stack1',itemstyle_opts=opts.ItemStyleOpts(border_color='rgb(220,220,220)', color='rgb(192,192,192)')).add_yaxis("金牌🏅️", [x[1] for x in t_data],stack='stack1',itemstyle_opts=opts.ItemStyleOpts(border_color='rgb(220,220,220)', color='rgb(255,215,0)')).set_series_opts(label_opts=opts.LabelOpts(is_show=True,position='insideRight',font_style='italic'), ).set_global_opts(title_opts=opts.TitleOpts(title="各国累计奖牌数(冬季奥运会)"),xaxis_opts=opts.AxisOpts(axislabel_opts=opts.LabelOpts(rotate=45)),legend_opts=opts.LegendOpts(is_show=True),graphic_opts=[opts.GraphicGroup(graphic_item=opts.GraphicItem(rotation=JsCode("Math.PI / 4"),bounding="raw",right=110,bottom=110,z=100),children=[opts.GraphicRect(graphic_item=opts.GraphicItem(left="center", top="center", z=100),graphic_shape_opts=opts.GraphicShapeOpts(width=400, height=50),graphic_basicstyle_opts=opts.GraphicBasicStyleOpts(fill="rgba(0,0,0,0.3)"),),opts.GraphicText(graphic_item=opts.GraphicItem(left="center", top="center", z=100),graphic_textstyle_opts=opts.GraphicTextStyleOpts(text='截止{}'.format(year),font="bold 26px Microsoft YaHei",graphic_basicstyle_opts=opts.GraphicBasicStyleOpts(fill="#fff"),),),],)], ).reversal_axis())tl.add(bar, year)tl.render(r".\\htmlRender\\02_各国累计奖牌数(冬季奥运会).html")
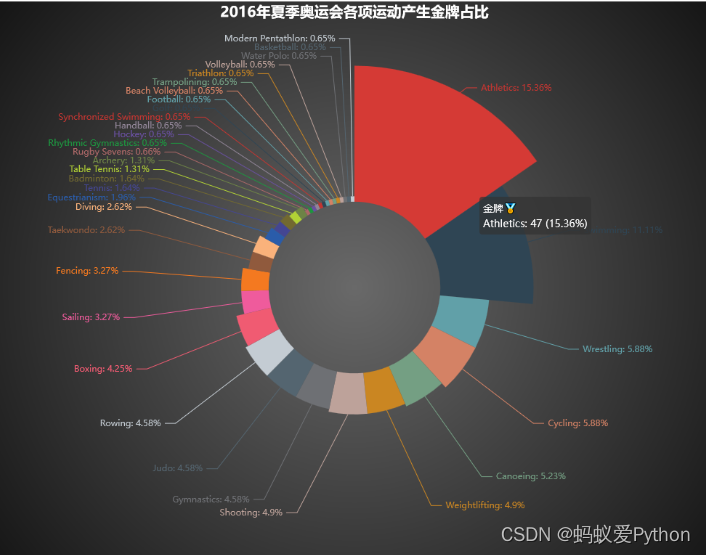
2.⚽️各项运动产生金牌数
import pandas as pd
from pyecharts.charts import *
from pyecharts import options as opts
from pyecharts.commons.utils import JsCodeathlete_data = pd.read_csv('./data/athlete_events.csv')
noc_region = pd.read_csv('./data/noc_regions.csv')# 关联代表国家
data = pd.merge(athlete_data, noc_region, on='NOC', how='left')
print(data.head())medal_data = data.groupby(['Year', 'Season', 'region', 'Medal'])['Event'].nunique().reset_index()
medal_data.columns = ['Year', 'Season', 'region', 'Medal', 'Nums']
medal_data = medal_data.sort_values(by="Year", ascending=True)background_color_js = """new echarts.graphic.RadialGradient(0.5, 0.5, 1, [{offset: 0,color: '#696969'}, {offset: 1,color: '#000000'}])"""tab = Tab()
temp = data[(data['Medal'] == 'Gold') & (data['Year'] == 2016) & (data['Season'] == 'Summer')]event_medal = temp.groupby(['Sport'])['Event'].nunique().reset_index()
event_medal.columns = ['Sport', 'Nums']
event_medal = event_medal.sort_values(by="Nums", ascending=False)pie = (Pie(init_opts=opts.InitOpts(bg_color=JsCode(background_color_js), width='1000px', height='800px')).add('金牌🏅️', [(row['Sport'], row['Nums']) for _, row in event_medal.iterrows()],radius=["30%", "75%"],rosetype="radius").set_global_opts(title_opts=opts.TitleOpts(title="2016年夏季奥运会各项运动产生金牌占比",pos_left="center",title_textstyle_opts=opts.TextStyleOpts(color="white",font_size=20), ),legend_opts=opts.LegendOpts(is_show=False)).set_series_opts(label_opts=opts.LabelOpts(formatter="{b}: {d}%"),tooltip_opts=opts.TooltipOpts(trigger="item", formatter="{a} <br/>{b}: {c} ({d}%)"), ))
tab.add(pie, '2016年夏奥会')temp = data[(data['Medal'] == 'Gold') & (data['Year'] == 2014) & (data['Season'] == 'Winter')]event_medal = temp.groupby(['Sport'])['Event'].nunique().reset_index()
event_medal.columns = ['Sport', 'Nums']
event_medal = event_medal.sort_values(by="Nums", ascending=False)pie = (Pie(init_opts=opts.InitOpts(bg_color=JsCode(background_color_js), width='1000px', height='800px')).add('金牌🏅️', [(row['Sport'], row['Nums']) for _, row in event_medal.iterrows()],radius=["30%", "75%"],rosetype="radius").set_global_opts(title_opts=opts.TitleOpts(title="2014年冬季奥运会各项运动产生金牌占比",pos_left="center",title_textstyle_opts=opts.TextStyleOpts(color="white",font_size=20), ),legend_opts=opts.LegendOpts(is_show=False)).set_series_opts(label_opts=opts.LabelOpts(formatter="{b}: {d}%"),tooltip_opts=opts.TooltipOpts(trigger="item", formatter="{a} <br/>{b}: {c} ({d}%)"), ))
tab.add(pie, '2014年冬奥会')
tab.render(r".\\htmlRender\\03_2016夏2014年冬奥会各项运动金牌数.html")
3.⛳️运动员层面
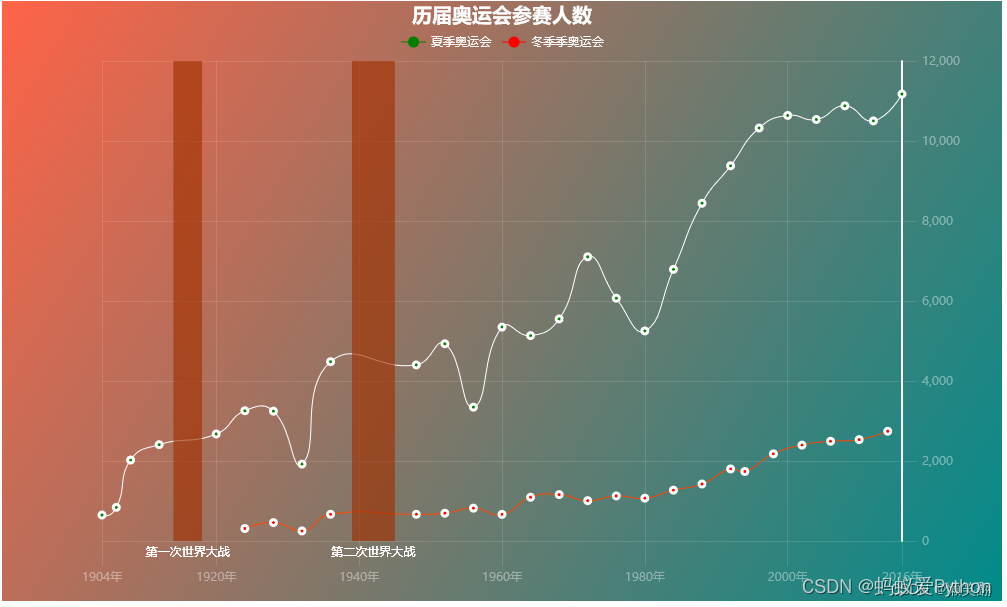
①参赛人数趋势
import pandas as pd
from pyecharts.charts import *
from pyecharts import options as opts
from pyecharts.commons.utils import JsCodeathlete_data = pd.read_csv('./data/athlete_events.csv')
noc_region = pd.read_csv('./data/noc_regions.csv')# 关联代表国家
data = pd.merge(athlete_data, noc_region, on='NOC', how='left')
print(data.head())medal_data = data.groupby(['Year', 'Season', 'region', 'Medal'])['Event'].nunique().reset_index()
medal_data.columns = ['Year', 'Season', 'region', 'Medal', 'Nums']
medal_data = medal_data.sort_values(by="Year", ascending=True)
athlete = data.groupby(['Year', 'Season'])['Name'].nunique().reset_index()
athlete.columns = ['Year', 'Season', 'Nums']
athlete = athlete.sort_values(by="Year", ascending=True)x_list, y1_list, y2_list = [], [], []for _, row in athlete.iterrows():x_list.append(str(row['Year']))if row['Season'] == 'Summer':y1_list.append(row['Nums'])y2_list.append(None)else:y2_list.append(row['Nums'])y1_list.append(None)background_color_js = ("new echarts.graphic.LinearGradient(1, 1, 0, 0, ""[{offset: 0, color: '#008B8B'}, {offset: 1, color: '#FF6347'}], false)"
)line = (Line(init_opts=opts.InitOpts(bg_color=JsCode(background_color_js), width='1000px', height='600px')).add_xaxis(x_list).add_yaxis("夏季奥运会",y1_list,is_smooth=True,is_connect_nones=True,symbol="circle",symbol_size=6,linestyle_opts=opts.LineStyleOpts(color="#fff"),label_opts=opts.LabelOpts(is_show=False, position="top", color="white"),itemstyle_opts=opts.ItemStyleOpts(color="green", border_color="#fff", border_width=3),tooltip_opts=opts.TooltipOpts(is_show=True)).add_yaxis("冬季季奥运会",y2_list,is_smooth=True,is_connect_nones=True,symbol="circle",symbol_size=6,linestyle_opts=opts.LineStyleOpts(color="#FF4500"),label_opts=opts.LabelOpts(is_show=False, position="top", color="white"),itemstyle_opts=opts.ItemStyleOpts(color="red", border_color="#fff", border_width=3),tooltip_opts=opts.TooltipOpts(is_show=True)).set_series_opts(markarea_opts=opts.MarkAreaOpts(label_opts=opts.LabelOpts(is_show=True, position="bottom", color="white"),data=[opts.MarkAreaItem(name="第一次世界大战", x=(1914, 1918)),opts.MarkAreaItem(name="第二次世界大战", x=(1939, 1945)),])).set_global_opts(title_opts=opts.TitleOpts(title="历届奥运会参赛人数",pos_left="center",title_textstyle_opts=opts.TextStyleOpts(color="white", font_size=20), ),legend_opts=opts.LegendOpts(is_show=True, pos_top='5%',textstyle_opts=opts.TextStyleOpts(color="white", font_size=12)),xaxis_opts=opts.AxisOpts(type_="value",min_=1904,max_=2016,boundary_gap=False,axislabel_opts=opts.LabelOpts(margin=30, color="#ffffff63",formatter=JsCode("""function (value) {return value+'年';}""")),axisline_opts=opts.AxisLineOpts(is_show=False),axistick_opts=opts.AxisTickOpts(is_show=True,length=25,linestyle_opts=opts.LineStyleOpts(color="#ffffff1f"),),splitline_opts=opts.SplitLineOpts(is_show=True, linestyle_opts=opts.LineStyleOpts(color="#ffffff1f")),),yaxis_opts=opts.AxisOpts(type_="value",position="right",axislabel_opts=opts.LabelOpts(margin=20, color="#ffffff63"),axisline_opts=opts.AxisLineOpts(linestyle_opts=opts.LineStyleOpts(width=2, color="#fff")),axistick_opts=opts.AxisTickOpts(is_show=True,length=15,linestyle_opts=opts.LineStyleOpts(color="#ffffff1f"),),splitline_opts=opts.SplitLineOpts(is_show=True, linestyle_opts=opts.LineStyleOpts(color="#ffffff1f")),), )
)line.render(r".\\htmlRender\\04_历届奥运会参赛人数.html")
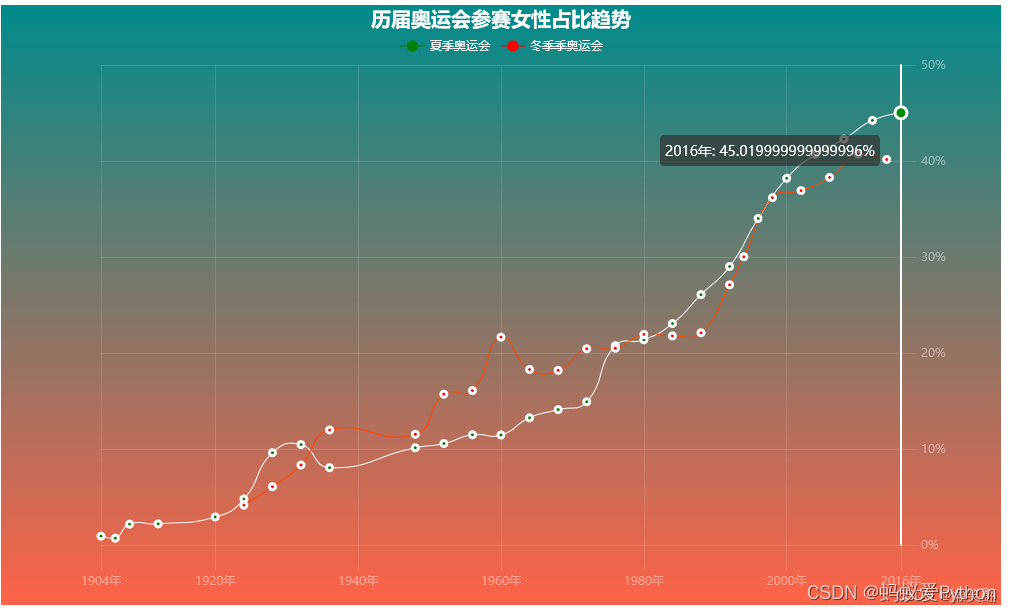
②女性参赛比例趋势
import pandas as pd
from pyecharts.charts import *
from pyecharts import options as opts
from pyecharts.commons.utils import JsCodeathlete_data = pd.read_csv('./data/athlete_events.csv')
noc_region = pd.read_csv('./data/noc_regions.csv')# 关联代表国家
data = pd.merge(athlete_data, noc_region, on='NOC', how='left')
print(data.head())medal_data = data.groupby(['Year', 'Season', 'region', 'Medal'])['Event'].nunique().reset_index()
medal_data.columns = ['Year', 'Season', 'region', 'Medal', 'Nums']
medal_data = medal_data.sort_values(by="Year", ascending=True)# 历年男性运动员人数
m_data = data[data.Sex == 'M'].groupby(['Year', 'Season'])['Name'].nunique().reset_index()
m_data.columns = ['Year', 'Season', 'M-Nums']
m_data = m_data.sort_values(by="Year", ascending=True)# 历年女性运动员人数
f_data = data[data.Sex == 'F'].groupby(['Year', 'Season'])['Name'].nunique().reset_index()
f_data.columns = ['Year', 'Season', 'F-Nums']
f_data = f_data.sort_values(by="Year", ascending=True)t_data = pd.merge(m_data, f_data, on=['Year', 'Season'])
t_data['F-rate'] = round(t_data['F-Nums'] / (t_data['F-Nums'] + t_data['M-Nums']), 4)x_list, y1_list, y2_list = [], [], []for _, row in t_data.iterrows():x_list.append(str(row['Year']))if row['Season'] == 'Summer':y1_list.append(row['F-rate'])y2_list.append(None)else:y2_list.append(row['F-rate'])y1_list.append(None)background_color_js = ("new echarts.graphic.LinearGradient(0, 0, 0, 1, ""[{offset: 0, color: '#008B8B'}, {offset: 1, color: '#FF6347'}], false)"
)line = (Line(init_opts=opts.InitOpts(bg_color=JsCode(background_color_js), width='1000px', height='600px')).add_xaxis(x_list).add_yaxis("夏季奥运会",y1_list,is_smooth=True,is_connect_nones=True,symbol="circle",symbol_size=6,linestyle_opts=opts.LineStyleOpts(color="#fff"),label_opts=opts.LabelOpts(is_show=False, position="top", color="white"),itemstyle_opts=opts.ItemStyleOpts(color="green", border_color="#fff", border_width=3),tooltip_opts=opts.TooltipOpts(is_show=True), ).add_yaxis("冬季季奥运会",y2_list,is_smooth=True,is_connect_nones=True,symbol="circle",symbol_size=6,linestyle_opts=opts.LineStyleOpts(color="#FF4500"),label_opts=opts.LabelOpts(is_show=False, position="top", color="white"),itemstyle_opts=opts.ItemStyleOpts(color="red", border_color="#fff", border_width=3),tooltip_opts=opts.TooltipOpts(is_show=True), ).set_series_opts(tooltip_opts=opts.TooltipOpts(trigger="item", formatter=JsCode("""function (params) {return params.data[0]+ '年: ' + Number(params.data[1])*100 +'%';}""")), ).set_global_opts(title_opts=opts.TitleOpts(title="历届奥运会参赛女性占比趋势",pos_left="center",title_textstyle_opts=opts.TextStyleOpts(color="white", font_size=20), ),legend_opts=opts.LegendOpts(is_show=True, pos_top='5%',textstyle_opts=opts.TextStyleOpts(color="white", font_size=12)),xaxis_opts=opts.AxisOpts(type_="value",min_=1904,max_=2016,boundary_gap=False,axislabel_opts=opts.LabelOpts(margin=30, color="#ffffff63",formatter=JsCode("""function (value) {return value+'年';}""")),axisline_opts=opts.AxisLineOpts(is_show=False),axistick_opts=opts.AxisTickOpts(is_show=True,length=25,linestyle_opts=opts.LineStyleOpts(color="#ffffff1f"),),splitline_opts=opts.SplitLineOpts(is_show=True, linestyle_opts=opts.LineStyleOpts(color="#ffffff1f")),),yaxis_opts=opts.AxisOpts(type_="value",position="right",axislabel_opts=opts.LabelOpts(margin=20, color="#ffffff63",formatter=JsCode("""function (value) {return Number(value *100)+'%';}""")),axisline_opts=opts.AxisLineOpts(linestyle_opts=opts.LineStyleOpts(width=2, color="#fff")),axistick_opts=opts.AxisTickOpts(is_show=True,length=15,linestyle_opts=opts.LineStyleOpts(color="#ffffff1f"),),splitline_opts=opts.SplitLineOpts(is_show=True, linestyle_opts=opts.LineStyleOpts(color="#ffffff1f")),), )
)line.render(r".\\htmlRender\\05_历届奥运会参赛女性占比趋势.html")
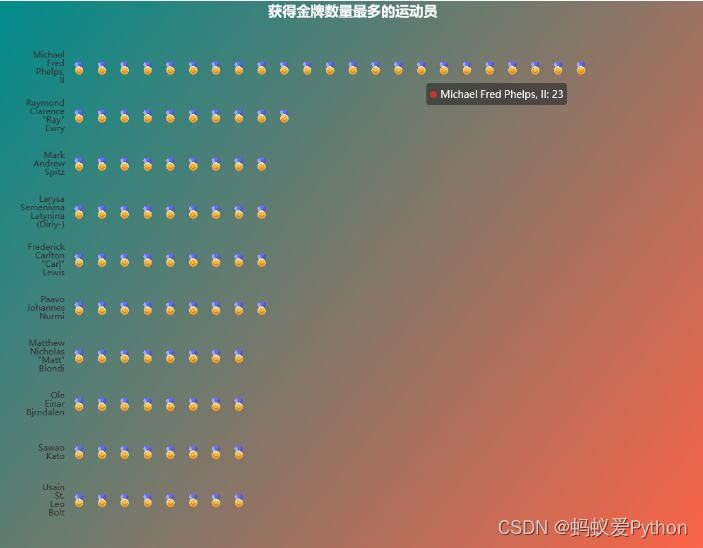
③获得金牌最多的运动员
import pandas as pd
from pyecharts.charts import *
from pyecharts import options as opts
from pyecharts.commons.utils import JsCodeathlete_data = pd.read_csv('./data/athlete_events.csv')
noc_region = pd.read_csv('./data/noc_regions.csv')# 关联代表国家
data = pd.merge(athlete_data, noc_region, on='NOC', how='left')
print(data.head())medal_data = data.groupby(['Year', 'Season', 'region', 'Medal'])['Event'].nunique().reset_index()
medal_data.columns = ['Year', 'Season', 'region', 'Medal', 'Nums']
medal_data = medal_data.sort_values(by="Year", ascending=True)temp = data[(data['Medal'] == 'Gold')]athlete = temp.groupby(['Name'])['Medal'].count().reset_index()
athlete.columns = ['Name', 'Nums']
athlete = athlete.sort_values(by="Nums", ascending=True)background_color_js = ("new echarts.graphic.LinearGradient(0, 0, 1, 1, ""[{offset: 0, color: '#008B8B'}, {offset: 1, color: '#FF6347'}], false)"
)pb = (PictorialBar(init_opts=opts.InitOpts(bg_color=JsCode(background_color_js), width='1000px', height='800px')).add_xaxis([x.replace(' ', '\\n') for x in athlete['Name'].tail(10).tolist()]).add_yaxis("",athlete['Nums'].tail(10).tolist(),label_opts=opts.LabelOpts(is_show=False),symbol_size=25,symbol_repeat='fixed',symbol_offset=[0, 0],is_symbol_clip=True,symbol='image://https://cdn.kesci.com/upload/image/q8f8otrlfc.png').reversal_axis().set_global_opts(title_opts=opts.TitleOpts(title="获得金牌数量最多的运动员", pos_left='center',title_textstyle_opts=opts.TextStyleOpts(color="white", font_size=20), ),xaxis_opts=opts.AxisOpts(is_show=False, ),yaxis_opts=opts.AxisOpts(axistick_opts=opts.AxisTickOpts(is_show=False),axisline_opts=opts.AxisLineOpts(linestyle_opts=opts.LineStyleOpts(opacity=0)),),))pb.render(r".\\htmlRender\\06_获得金牌数量最多的运动员.html")
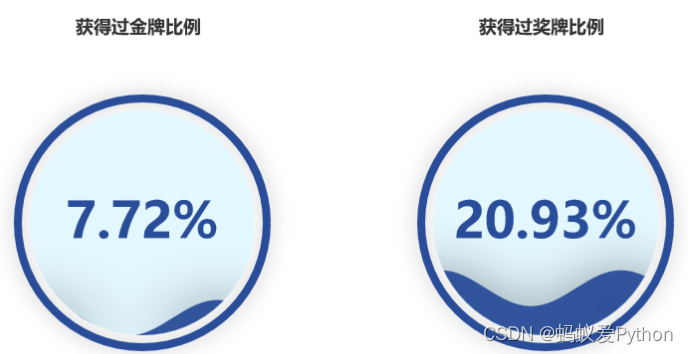
④获得奖牌/金牌比例
import pandas as pd
from pyecharts.charts import *
from pyecharts import options as opts
from pyecharts.commons.utils import JsCodeathlete_data = pd.read_csv('./data/athlete_events.csv')
noc_region = pd.read_csv('./data/noc_regions.csv')# 关联代表国家
data = pd.merge(athlete_data, noc_region, on='NOC', how='left')
print(data.head())medal_data = data.groupby(['Year', 'Season', 'region', 'Medal'])['Event'].nunique().reset_index()
medal_data.columns = ['Year', 'Season', 'region', 'Medal', 'Nums']
medal_data = medal_data.sort_values(by="Year", ascending=True)total_athlete = len(set(data['Name']))
medal_athlete = len(set(data['Name'][data['Medal'].isin(['Gold', 'Silver', 'Bronze'])]))
gold_athlete = len(set(data['Name'][data['Medal'] == 'Gold']))l1 = Liquid(init_opts=opts.InitOpts(theme='dark', width='1000px', height='800px'))
l1.add("获得奖牌", [medal_athlete / total_athlete],center=["70%", "50%"],label_opts=opts.LabelOpts(font_size=50,formatter=JsCode("""function (param) {return (Math.floor(param.value * 10000) / 100) + '%';}"""),position="inside",))
l1.set_global_opts(title_opts=opts.TitleOpts(title="获得过奖牌比例", pos_left='62%', pos_top='8%'))
l1.set_series_opts(tooltip_opts=opts.TooltipOpts(is_show=False))l2 = Liquid(init_opts=opts.InitOpts(theme='dark', width='1000px', height='800px'))
l2.add("获得金牌",[gold_athlete / total_athlete],center=["25%", "50%"],label_opts=opts.LabelOpts(font_size=50,formatter=JsCode("""function (param) {return (Math.floor(param.value * 10000) / 100) + '%';}"""),position="inside",), )
l2.set_global_opts(title_opts=opts.TitleOpts(title="获得过金牌比例", pos_left='17%', pos_top='8%'))
l2.set_series_opts(tooltip_opts=opts.TooltipOpts(is_show=False))grid = Grid().add(l1, grid_opts=opts.GridOpts()).add(l2, grid_opts=opts.GridOpts())
grid.render(r".\\htmlRender\\07_获得金牌奖牌比例.html")
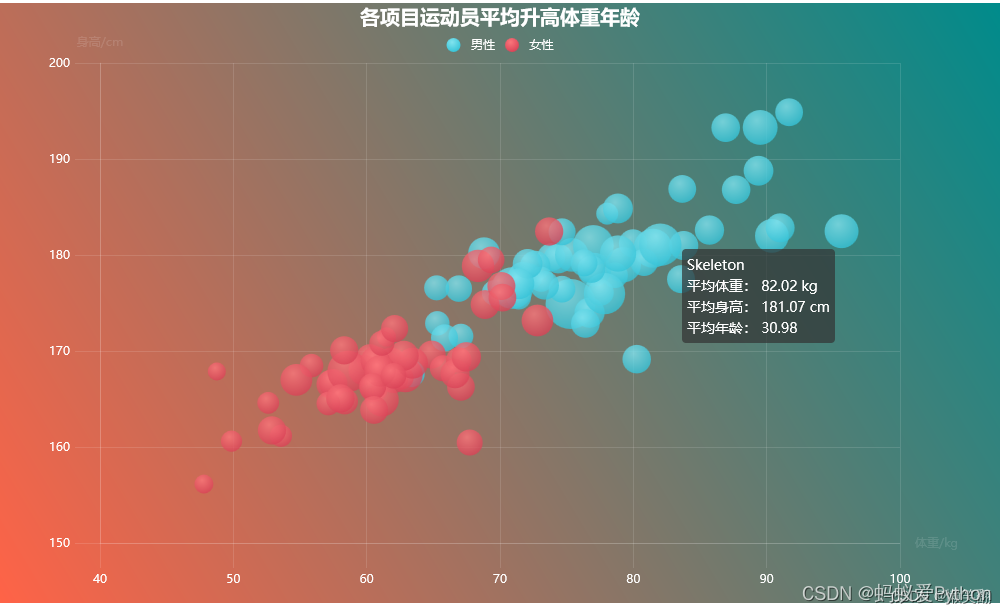
⑤各项目运动员平均体质数据
import pandas as pd
from pyecharts.charts import *
from pyecharts import options as opts
from pyecharts.commons.utils import JsCodeathlete_data = pd.read_csv('./data/athlete_events.csv')
noc_region = pd.read_csv('./data/noc_regions.csv')# 关联代表国家
data = pd.merge(athlete_data, noc_region, on='NOC', how='left')
print(data.head())medal_data = data.groupby(['Year', 'Season', 'region', 'Medal'])['Event'].nunique().reset_index()
medal_data.columns = ['Year', 'Season', 'region', 'Medal', 'Nums']
medal_data = medal_data.sort_values(by="Year", ascending=True)tool_js = """function (param) {return param.data[2] +'<br/>' +'平均体重: '+Number(param.data[0]).toFixed(2)+' kg<br/>'+'平均身高: '+Number(param.data[1]).toFixed(2)+' cm<br/>'+'平均年龄: '+Number(param.data[3]).toFixed(2);}"""background_color_js = ("new echarts.graphic.LinearGradient(1, 0, 0, 1, ""[{offset: 0, color: '#008B8B'}, {offset: 1, color: '#FF6347'}], false)"
)temp_data = data[data['Sex'] == 'M'].groupby(['Sport'])[['Age', 'Height', 'Weight']].mean().reset_index().dropna(how='any')scatter = (Scatter(init_opts=opts.InitOpts(bg_color=JsCode(background_color_js), width='1000px', height='600px'))
.add_xaxis(temp_data['Weight'].tolist())
.add_yaxis("男性", [[row['Height'], row['Sport'], row['Age']] for _, row in temp_data.iterrows()],# 渐变效果实现部分color=JsCode("""new echarts.graphic.RadialGradient(0.4, 0.3, 1, [{offset: 0,color: 'rgb(129, 227, 238)'}, {offset: 1,color: 'rgb(25, 183, 207)'}])"""))
.set_series_opts(label_opts=opts.LabelOpts(is_show=False))
.set_global_opts(title_opts=opts.TitleOpts(title="各项目运动员平均升高体重年龄", pos_left="center",title_textstyle_opts=opts.TextStyleOpts(color="white", font_size=20)),legend_opts=opts.LegendOpts(is_show=True, pos_top='5%',textstyle_opts=opts.TextStyleOpts(color="white", font_size=12)),tooltip_opts=opts.TooltipOpts(formatter=JsCode(tool_js)),xaxis_opts=opts.AxisOpts(name='体重/kg',# 设置坐标轴为数值类型type_="value",is_scale=True,# 显示分割线axislabel_opts=opts.LabelOpts(margin=30, color="white"),axisline_opts=opts.AxisLineOpts(is_show=True, linestyle_opts=opts.LineStyleOpts(color="#ffffff1f")),axistick_opts=opts.AxisTickOpts(is_show=True, length=25,linestyle_opts=opts.LineStyleOpts(color="#ffffff1f")),splitline_opts=opts.SplitLineOpts(is_show=True, linestyle_opts=opts.LineStyleOpts(color="#ffffff1f"))),yaxis_opts=opts.AxisOpts(name='身高/cm',# 设置坐标轴为数值类型type_="value",# 默认为False表示起始为0is_scale=True,axislabel_opts=opts.LabelOpts(margin=30, color="white"),axisline_opts=opts.AxisLineOpts(is_show=True, linestyle_opts=opts.LineStyleOpts(color="#ffffff1f")),axistick_opts=opts.AxisTickOpts(is_show=True, length=25,linestyle_opts=opts.LineStyleOpts(color="#ffffff1f")),splitline_opts=opts.SplitLineOpts(is_show=True, linestyle_opts=opts.LineStyleOpts(color="#ffffff1f"))),visualmap_opts=opts.VisualMapOpts(is_show=False, type_='size', range_size=[5, 50], min_=10, max_=40)
))temp_data = data[data['Sex'] == 'F'].groupby(['Sport'])[['Age', 'Height', 'Weight']].mean().reset_index().dropna(how='any')scatter1 = (Scatter().add_xaxis(temp_data['Weight'].tolist()).add_yaxis("女性", [[row['Height'], row['Sport'], row['Age']] for _, row in temp_data.iterrows()],itemstyle_opts=opts.ItemStyleOpts(color=JsCode("""new echarts.graphic.RadialGradient(0.4, 0.3, 1, [{offset: 0,color: 'rgb(251, 118, 123)'}, {offset: 1,color: 'rgb(204, 46, 72)'}])"""))).set_series_opts(label_opts=opts.LabelOpts(is_show=False)))
scatter.overlap(scatter1)
scatter.render(r".\\htmlRender\\08_运动员平均体质数据.html")
4.中国表现
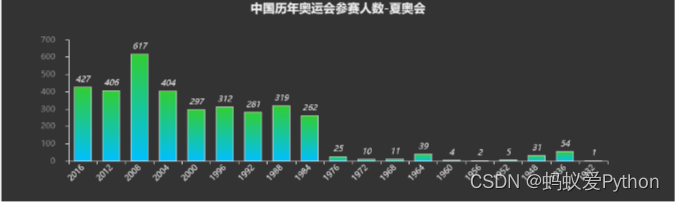
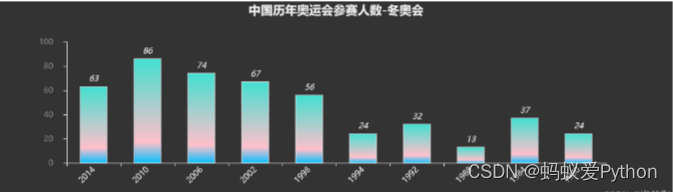
①中国历届奥运会参赛人数
import pandas as pd
from pyecharts.charts import *
from pyecharts import options as opts
from pyecharts.commons.utils import JsCodeathlete_data = pd.read_csv('./data/athlete_events.csv')
noc_region = pd.read_csv('./data/noc_regions.csv')# 关联代表国家
data = pd.merge(athlete_data, noc_region, on='NOC', how='left')
print(data.head())medal_data = data.groupby(['Year', 'Season', 'region', 'Medal'])['Event'].nunique().reset_index()
medal_data.columns = ['Year', 'Season', 'region', 'Medal', 'Nums']
medal_data = medal_data.sort_values(by="Year", ascending=True)CN_data = data[data.region == 'China']
CN_data.head()background_color_js = ("new echarts.graphic.LinearGradient(1, 0, 0, 1, ""[{offset: 0, color: '#008B8B'}, {offset: 1, color: '#FF6347'}], false)"
)athlete = CN_data.groupby(['Year', 'Season'])['Name'].nunique().reset_index()
athlete.columns = ['Year', 'Season', 'Nums']
athlete = athlete.sort_values(by="Year", ascending=False)s_bar = (Bar(init_opts=opts.InitOpts(theme='dark', width='1000px', height='300px')).add_xaxis([row['Year'] for _, row in athlete[athlete.Season == 'Summer'].iterrows()]).add_yaxis("参赛人数", [row['Nums'] for _, row in athlete[athlete.Season == 'Summer'].iterrows()],category_gap='40%',itemstyle_opts=opts.ItemStyleOpts(border_color='rgb(220,220,220)',color=JsCode("""new echarts.graphic.LinearGradient(0, 0, 0, 1, [{offset: 1,color: '#00BFFF'}, {offset: 0,color: '#32CD32'}])"""))).set_series_opts(label_opts=opts.LabelOpts(is_show=True,position='top',font_style='italic')).set_global_opts(title_opts=opts.TitleOpts(title="中国历年奥运会参赛人数-夏奥会", pos_left='center'),xaxis_opts=opts.AxisOpts(axislabel_opts=opts.LabelOpts(rotate=45)),legend_opts=opts.LegendOpts(is_show=False),yaxis_opts=opts.AxisOpts(axislabel_opts=opts.LabelOpts(margin=20, color="#ffffff63")),graphic_opts=[opts.GraphicImage(graphic_item=opts.GraphicItem(id_="logo", right=0, top=0, z=-10, bounding="raw", origin=[75, 75]),graphic_imagestyle_opts=opts.GraphicImageStyleOpts(image="https://timgsa.baidu.com/timg?image&quality=80&size=b9999_10000&sec=1586619952245&di=981a36305048f93eec791980acc99cf7&imgtype=0&src=http%3A%2F%2Fimg5.mtime.cn%2Fmg%2F2017%2F01%2F06%2F172210.42721559.jpg",width=1000,height=600,opacity=0.6, ),)], )
)w_bar = (Bar(init_opts=opts.InitOpts(theme='dark', width='1000px', height='300px')).add_xaxis([row['Year'] for _, row in athlete[athlete.Season == 'Winter'].iterrows()]).add_yaxis("参赛人数", [row['Nums'] for _, row in athlete[athlete.Season == 'Winter'].iterrows()],category_gap='50%',itemstyle_opts=opts.ItemStyleOpts(border_color='rgb(220,220,220)',color=JsCode("""new echarts.graphic.LinearGradient(0, 0, 0, 1, [{offset: 1,color: '#00BFFF'}, {offset: 0.8,color: '#FFC0CB'}, {offset: 0,color: '#40E0D0'}])"""))).set_series_opts(label_opts=opts.LabelOpts(is_show=True,position='top',font_style='italic')).set_global_opts(title_opts=opts.TitleOpts(title="中国历年奥运会参赛人数-冬奥会", pos_left='center'),xaxis_opts=opts.AxisOpts(axislabel_opts=opts.LabelOpts(rotate=45)),legend_opts=opts.LegendOpts(is_show=False),yaxis_opts=opts.AxisOpts(axislabel_opts=opts.LabelOpts(margin=20, color="#ffffff63")),graphic_opts=[opts.GraphicImage(graphic_item=opts.GraphicItem(id_="logo", right=0, top=-300, z=-10, bounding="raw", origin=[75, 75]),graphic_imagestyle_opts=opts.GraphicImageStyleOpts(image="https://timgsa.baidu.com/timg?image&quality=80&size=b9999_10000&sec=1586619952245&di=981a36305048f93eec791980acc99cf7&imgtype=0&src=http%3A%2F%2Fimg5.mtime.cn%2Fmg%2F2017%2F01%2F06%2F172210.42721559.jpg",width=1000,height=600,opacity=0.6, ),)], )
)page = (Page().add(s_bar, ).add(w_bar, )
)
page.render(r".\\htmlRender\\09_历届奥运会参赛人数.html")
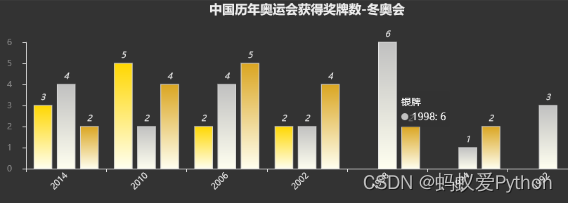
②中国历届奥运会奖牌数
import pandas as pd
from pyecharts.charts import *
from pyecharts import options as opts
from pyecharts.commons.utils import JsCodeathlete_data = pd.read_csv('./data/athlete_events.csv')
noc_region = pd.read_csv('./data/noc_regions.csv')# 关联代表国家
data = pd.merge(athlete_data, noc_region, on='NOC', how='left')
print(data.head())medal_data = data.groupby(['Year', 'Season', 'region', 'Medal'])['Event'].nunique().reset_index()
medal_data.columns = ['Year', 'Season', 'region', 'Medal', 'Nums']
medal_data = medal_data.sort_values(by="Year", ascending=True)CN_data = data[data.region == 'China']
CN_data.head()background_color_js = ("new echarts.graphic.LinearGradient(1, 0, 0, 1, ""[{offset: 0, color: '#008B8B'}, {offset: 1, color: '#FF6347'}], false)"
)CN_medals = CN_data.groupby(['Year', 'Season', 'Medal'])['Event'].nunique().reset_index()
CN_medals.columns = ['Year', 'Season', 'Medal', 'Nums']
CN_medals = CN_medals.sort_values(by="Year", ascending=False)s_bar = (Bar(init_opts=opts.InitOpts(theme='dark', width='1000px', height='300px')).add_xaxis(sorted(list(set([row['Year'] for _, row in CN_medals[CN_medals.Season == 'Summer'].iterrows()])), reverse=True)).add_yaxis("金牌", [row['Nums'] for _, row inCN_medals[(CN_medals.Season == 'Summer') & (CN_medals.Medal == 'Gold')].iterrows()],category_gap='20%',itemstyle_opts=opts.ItemStyleOpts(border_color='rgb(220,220,220)',color=JsCode("""new echarts.graphic.LinearGradient(0, 0, 0, 1, [{offset: 0,color: '#FFD700'}, {offset: 1,color: '#FFFFF0'}])"""))).add_yaxis("银牌", [row['Nums'] for _, row inCN_medals[(CN_medals.Season == 'Summer') & (CN_medals.Medal == 'Silver')].iterrows()],category_gap='20%',itemstyle_opts=opts.ItemStyleOpts(border_color='rgb(220,220,220)',color=JsCode("""new echarts.graphic.LinearGradient(0, 0, 0, 1, [{offset: 0,color: '#C0C0C0'}, {offset: 1,color: '#FFFFF0'}])"""))).add_yaxis("铜牌", [row['Nums'] for _, row inCN_medals[(CN_medals.Season == 'Summer') & (CN_medals.Medal == 'Bronze')].iterrows()],category_gap='20%',itemstyle_opts=opts.ItemStyleOpts(border_color='rgb(220,220,220)',color=JsCode("""new echarts.graphic.LinearGradient(0, 0, 0, 1, [{offset: 0,color: '#DAA520'}, {offset: 1,color: '#FFFFF0'}])"""))).set_series_opts(label_opts=opts.LabelOpts(is_show=True,position='top',font_style='italic')).set_global_opts(title_opts=opts.TitleOpts(title="中国历年奥运会获得奖牌数数-夏奥会", pos_left='center'),xaxis_opts=opts.AxisOpts(axislabel_opts=opts.LabelOpts(rotate=45)),legend_opts=opts.LegendOpts(is_show=False),yaxis_opts=opts.AxisOpts(axislabel_opts=opts.LabelOpts(margin=20, color="#ffffff63")),graphic_opts=[opts.GraphicImage(graphic_item=opts.GraphicItem(id_="logo", right=0, top=0, z=-10, bounding="raw", origin=[75, 75]),graphic_imagestyle_opts=opts.GraphicImageStyleOpts(image="https://timgsa.baidu.com/timg?image&quality=80&size=b9999_10000&sec=1586619952245&di=981a36305048f93eec791980acc99cf7&imgtype=0&src=http%3A%2F%2Fimg5.mtime.cn%2Fmg%2F2017%2F01%2F06%2F172210.42721559.jpg",width=1000,height=600,opacity=0.6, ),)], )
)w_bar = (Bar(init_opts=opts.InitOpts(theme='dark', width='1000px', height='300px')).add_xaxis(sorted(list(set([row['Year'] for _, row in CN_medals[CN_medals.Season == 'Winter'].iterrows()])), reverse=True)).add_yaxis("金牌", [row['Nums'] for _, row inCN_medals[(CN_medals.Season == 'Winter') & (CN_medals.Medal == 'Gold')].iterrows()],category_gap='20%',itemstyle_opts=opts.ItemStyleOpts(border_color='rgb(220,220,220)',color=JsCode("""new echarts.graphic.LinearGradient(0, 0, 0, 1, [{offset: 0,color: '#FFD700'}, {offset: 1,color: '#FFFFF0'}])"""))).add_yaxis("银牌", [row['Nums'] for _, row inCN_medals[(CN_medals.Season == 'Winter') & (CN_medals.Medal == 'Silver')].iterrows()],category_gap='20%',itemstyle_opts=opts.ItemStyleOpts(border_color='rgb(220,220,220)',color=JsCode("""new echarts.graphic.LinearGradient(0, 0, 0, 1, [{offset: 0,color: '#C0C0C0'}, {offset: 1,color: '#FFFFF0'}])"""))).add_yaxis("铜牌", [row['Nums'] for _, row inCN_medals[(CN_medals.Season == 'Winter') & (CN_medals.Medal == 'Bronze')].iterrows()],category_gap='20%',itemstyle_opts=opts.ItemStyleOpts(border_color='rgb(220,220,220)',color=JsCode("""new echarts.graphic.LinearGradient(0, 0, 0, 1, [{offset: 0,color: '#DAA520'}, {offset: 1,color: '#FFFFF0'}])"""))).set_series_opts(label_opts=opts.LabelOpts(is_show=True,position='top',font_style='italic')).set_global_opts(title_opts=opts.TitleOpts(title="中国历年奥运会获得奖牌数-冬奥会", pos_left='center'),xaxis_opts=opts.AxisOpts(axislabel_opts=opts.LabelOpts(rotate=45)),legend_opts=opts.LegendOpts(is_show=False),yaxis_opts=opts.AxisOpts(axislabel_opts=opts.LabelOpts(margin=20, color="#ffffff63")),graphic_opts=[opts.GraphicImage(graphic_item=opts.GraphicItem(id_="logo", right=0, top=-300, z=-10, bounding="raw", origin=[75, 75]),graphic_imagestyle_opts=opts.GraphicImageStyleOpts(image="https://timgsa.baidu.com/timg?image&quality=80&size=b9999_10000&sec=1586619952245&di=981a36305048f93eec791980acc99cf7&imgtype=0&src=http%3A%2F%2Fimg5.mtime.cn%2Fmg%2F2017%2F01%2F06%2F172210.42721559.jpg",width=1000,height=600,opacity=0.6, ),)], )
)page = (Page().add(s_bar, ).add(w_bar, )
)
page.render(r".\\htmlRender\\10_中国历届奥运会奖牌数.html")

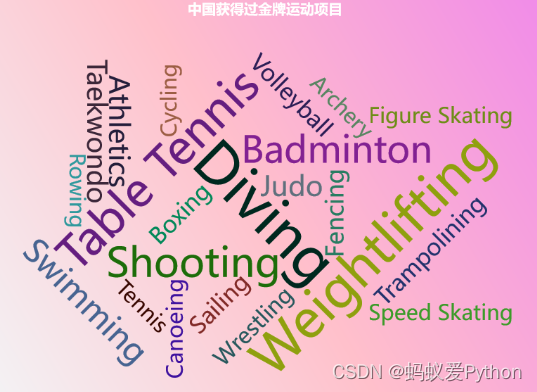
③中国优势项目
import pandas as pd
from pyecharts.charts import *
from pyecharts import options as opts
from pyecharts.commons.utils import JsCodeathlete_data = pd.read_csv('./data/athlete_events.csv')
noc_region = pd.read_csv('./data/noc_regions.csv')# 关联代表国家
data = pd.merge(athlete_data, noc_region, on='NOC', how='left')
print(data.head())medal_data = data.groupby(['Year', 'Season', 'region', 'Medal'])['Event'].nunique().reset_index()
medal_data.columns = ['Year', 'Season', 'region', 'Medal', 'Nums']
medal_data = medal_data.sort_values(by="Year", ascending=True)CN_data = data[data.region == 'China']
CN_data.head()background_color_js = ("new echarts.graphic.LinearGradient(1, 0, 0, 1, ""[{offset: 0.5, color: '#FFC0CB'}, {offset: 1, color: '#F0FFFF'}, {offset: 0, color: '#EE82EE'}], false)"
)CN_events = CN_data[CN_data.Medal == 'Gold'].groupby(['Year', 'Sport'])['Event'].nunique().reset_index()
CN_events = CN_events.groupby(['Sport'])['Event'].sum().reset_index()
CN_events.columns = ['Sport', 'Nums']data_pair = [(row['Sport'], row['Nums']) for _, row in CN_events.iterrows()]wc = (WordCloud(init_opts=opts.InitOpts(bg_color=JsCode(background_color_js), width='1000px', height='600px')).add("", data_pair, word_size_range=[30, 80]).set_global_opts(title_opts=opts.TitleOpts(title="中国获得过金牌运动项目", pos_left="center",title_textstyle_opts=opts.TextStyleOpts(color="white", font_size=20))))wc.render(r".\\htmlRender\\11_中国优势项目.html")
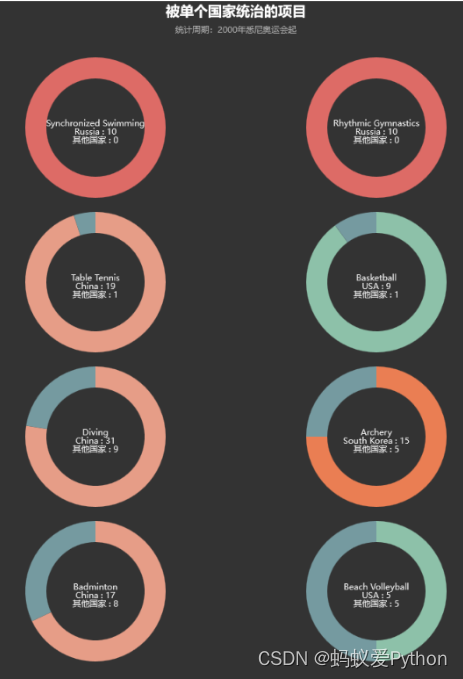
5.💥被单个国家统治的奥运会项目
import pandas as pd
from pyecharts.charts import *
from pyecharts import options as opts
from pyecharts.commons.utils import JsCodeathlete_data = pd.read_csv('./data/athlete_events.csv')
noc_region = pd.read_csv('./data/noc_regions.csv')# 关联代表国家
data = pd.merge(athlete_data, noc_region, on='NOC', how='left')
print(data.head())medal_data = data.groupby(['Year', 'Season', 'region', 'Medal'])['Event'].nunique().reset_index()
medal_data.columns = ['Year', 'Season', 'region', 'Medal', 'Nums']
medal_data = medal_data.sort_values(by="Year", ascending=True)f1 = lambda x: max(x['Event']) / sum(x['Event'])
f2 = lambda x: x.sort_values('Event', ascending=False).head(1)t_data = \\data[(data.Medal == 'Gold') & (data.Year >= 2000) & (data.Season == 'Summer')].groupby(['Year', 'Sport', 'region'])['Event'].nunique().reset_index()
t_data = t_data.groupby(['Sport', 'region'])['Event'].sum().reset_index()
t1 = t_data.groupby(['Sport']).apply(f2).reset_index(drop=True)
t2 = t_data.groupby(['Sport'])['Event'].sum().reset_index()
t_data = pd.merge(t1, t2, on='Sport', how='inner')
t_data['gold_rate'] = t_data.Event_x / t_data.Event_y
t_data = t_data.sort_values('gold_rate', ascending=False).reset_index(drop=True)t_data = t_data[(t_data.gold_rate >= 0.5) & (t_data.Event_y >= 10)]background_color_js = ("new echarts.graphic.LinearGradient(1, 0, 0, 1, ""[{offset: 0, color: '#008B8B'}, {offset: 1, color: '#FF6347'}], false)"
)fn = """function(params) {if(params.name == '其他国家')return '\\\\n\\\\n\\\\n' + params.name + ' : ' + params.value ;return params.seriesName+ '\\\\n' + params.name + ' : ' + params.value;}"""def new_label_opts():return opts.LabelOpts(formatter=JsCode(fn), position="center")pie = Pie(init_opts=opts.InitOpts(theme='dark', width='1000px', height='1000px'))
idx = 0for _, row in t_data.iterrows():if idx % 2 == 0:x = 30y = int(idx / 2) * 22 + 18else:x = 70y = int(idx / 2) * 22 + 18idx += 1pos_x = str(x) + '%'pos_y = str(y) + '%'pie.add(row['Sport'],[[row['region'], row['Event_x']], ['其他国家', row['Event_y'] - row['Event_x']]],center=[pos_x, pos_y],radius=[70, 100],label_opts=new_label_opts(), )pie.set_global_opts(title_opts=opts.TitleOpts(title="被单个国家统治的项目",subtitle='统计周期:2000年悉尼奥运会起',pos_left="center",title_textstyle_opts=opts.TextStyleOpts(color="white", font_size=20)),legend_opts=opts.LegendOpts(is_show=False),
)pie.render(r".\\htmlRender\\12_被单个国家统治的奥运会项目.html")
👇问题解答 · 源码获取 · 技术交流 · 抱团学习请联系👇