Learn OpenCV by Examples - with Python

目录
关于OpenCV
新增内容
Content
1.锐化
2.阈值,二值化和自适应阈值
本文是自己在kaggle上学习OpenCV的学习笔记,如果对你有所帮助再好不过了。这是原文链接Learn OpenCV by Examples - with Python | Kaggle里面不仅有代码还有图片等。如果你还没有注册kaggle可以参考这篇文章http://t.csdn.cn/oUkxY可以使你不用翻墙快速注册。在参考和在kaggle学习时,需要一定的英语基础。
关于OpenCV
OpenCV(开源计算机视觉)正式发布于1999年,由英特尔发起。
OpenCV的核心是用c++编写的。在python中,我们只是使用一个包装器在python内部执行c++代码。
第一个主要版本1.0是在2006年,第二个是在2009年,第三个是在2015年,第四个是在2018年。使用OpenCV 4.0测试版。
它是一个包含超过2500个优化算法的开源库。
它对几乎所有计算机视觉应用程序都非常有用,并且支持Windows, Linux, MacOS, Android, iOS,绑定到Python, Java和Matlab。
更新(19.05.2020)
我将一直努力改进这个内核。我对这个版本做了一些补充。谢谢你的阅读,希望对你有帮助
新增内容
17.背景减法
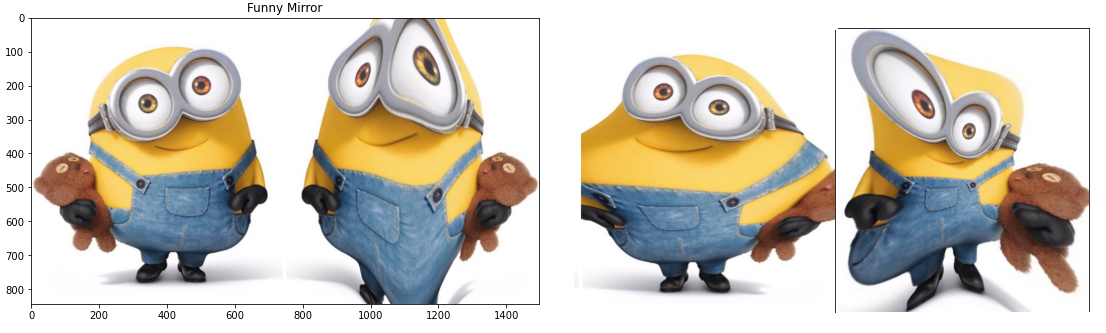
18.有趣的镜子使用OpenCV
Content
- Sharpening
- Thresholding, Binarization & Adaptive Thresholding
- Dilation, Erosion, Opening and Closing
- Edge Detection & Image Gradients
- Perpsective Transform
- Scaling, re-sizing and interpolations
- Image Pyramids
- Cropping
- Blurring
- Contours
- Approximating Contours and Convex Hull
- Identifiy Contours by Shape
- Line Detection - Using Hough Lines
- Counting Circles and Ellipses
- Finding Corners
- Finding Waldo
- Background Subtraction Methods
- Funny Mirrors Using OpenCV
Background Subtraction Methods Output
Funny Mirrors Using OpenCV Output
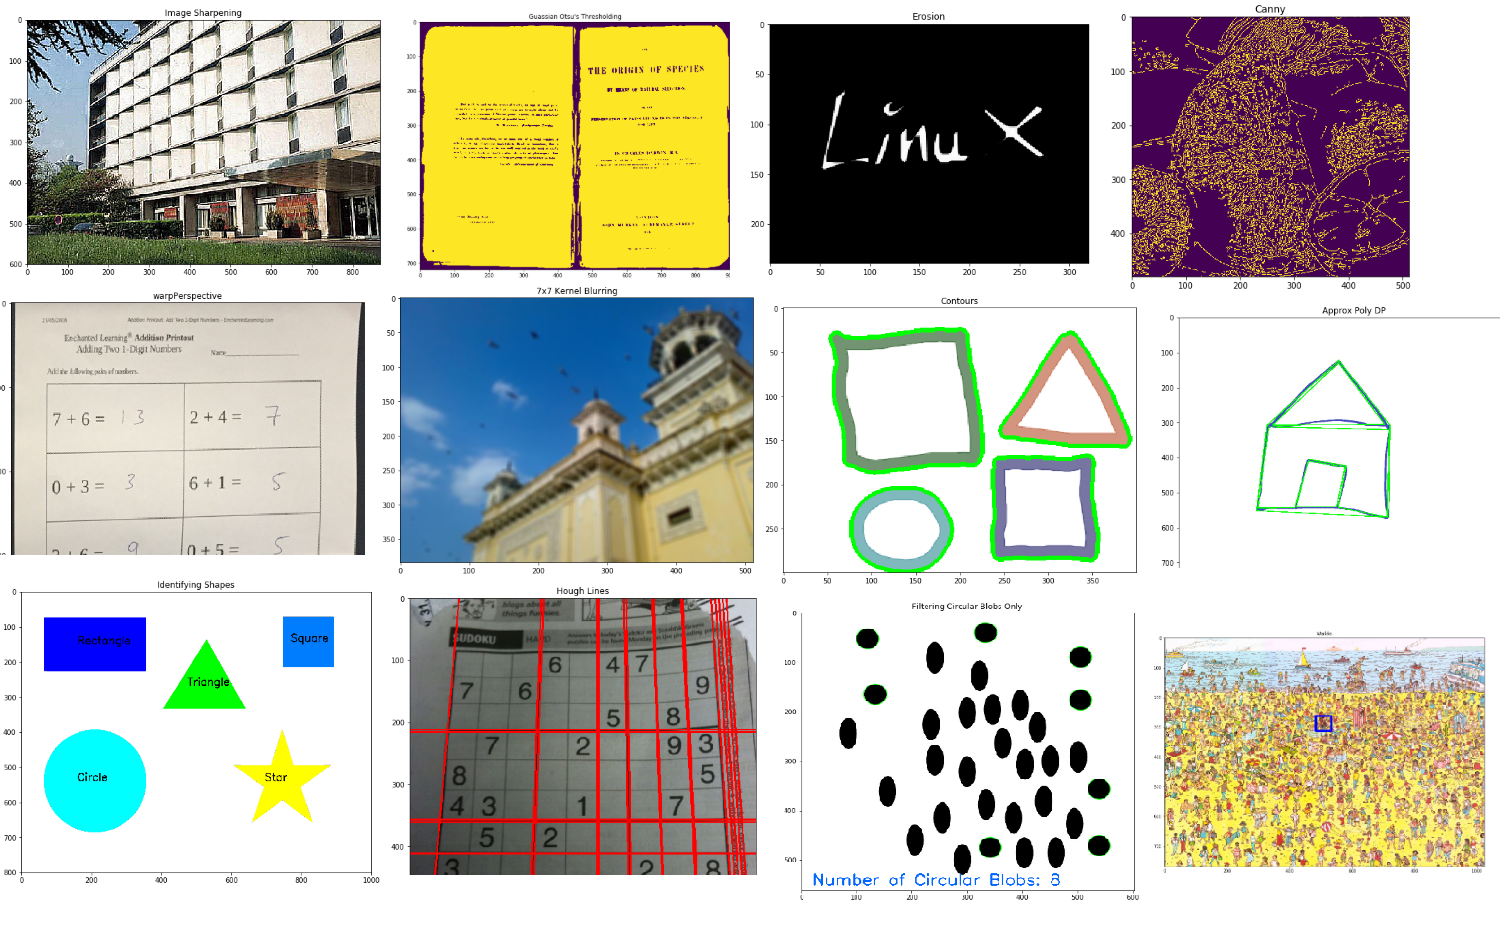
Some pictures from content
导入包:
import numpy as np
import matplotlib.pyplot as plt
import cv2
1.锐化
通过改变我们的核,我们可以实现锐化,它具有增强或强调图像边缘的效果。
image = cv2.imread('/kaggle/input/opencv-samples-images/data/building.jpg')
image = cv2.cvtColor(image, cv2.COLOR_BGR2RGB)plt.figure(figsize=(20, 20))
plt.subplot(1, 2, 1)
plt.title("Original")
plt.imshow(image)# Create our shapening kernel, we don't normalize since the
# the values in the matrix sum to 1
kernel_sharpening = np.array([[-1,-1,-1], [-1,9,-1], [-1,-1,-1]])# applying different kernels to the input image
sharpened = cv2.filter2D(image, -1, kernel_sharpening)plt.subplot(1, 2, 2)
plt.title("Image Sharpening")
plt.imshow(sharpened)plt.show()

2.阈值,二值化和自适应阈值
import numpy as np
import cv2
from matplotlib import pyplot as plt
# Load our new images
image = cv2.imread('images/Origin_of_Species.jpg', 0)plt.figure(figsize=(30, 30))
plt.subplot(3, 2, 1)
plt.title("Original")
plt.imshow(image)# Values below 127 goes to 0 (black, everything above goes to 255 (white)
ret,thresh1 = cv2.threshold(image, 127, 255, cv2.THRESH_BINARY)plt.subplot(3, 2, 2)
plt.title("Threshold Binary")
plt.imshow(thresh1)# It's good practice to blur images as it removes noise
image = cv2.GaussianBlur(image, (3, 3), 0)# Using adaptiveThreshold
thresh = cv2.adaptiveThreshold(image, 255, cv2.ADAPTIVE_THRESH_MEAN_C, cv2.THRESH_BINARY, 3, 5)plt.subplot(3, 2, 3)
plt.title("Adaptive Mean Thresholding")
plt.imshow(thresh)_, th2 = cv2.threshold(image, 0, 255, cv2.THRESH_BINARY + cv2.THRESH_OTSU)plt.subplot(3, 2, 4)
plt.title("Otsu's Thresholding")
plt.imshow(th2)plt.subplot(3, 2, 5)
# Otsu's thresholding after Gaussian filtering
blur = cv2.GaussianBlur(image, (5,5), 0)
_, th3 = cv2.threshold(blur, 0, 255, cv2.THRESH_BINARY + cv2.THRESH_OTSU)
plt.title("Guassian Otsu's Thresholding")
plt.imshow(th3)
plt.show()
持续更新...
参考资料:Learn OpenCV by Examples - with Python | Kaggle