新版本ProPhet时间序列预测1:模型解释和安装和初步使用

ProPhet时间序列预测1安装和初步使用
安装
安装1.0版本之后:
区别: 1.0版本叫prophet <1.0版本叫fbprophet
1.0以下版本安装
pip安装
备注(不建议pip安装 如果安装报错解决如下):
pip install pystan报错先安装以下在安装pystan
Cython
convertdate
lunarcalendar
holidays
tqdm
pytanpip install fbprophet报错 先安装以下
pandas
convertdate
lunarcalendar
holidays其中0.7版本的pfprophet需要指定numpy版本小于1.24, pandas需要支持append方法的旧版本
pip install numpy==1.23.5
pip install pandas==1.0.3
conda安装
1.0 以下安装
conda install pystan
conda install -c conda-forge fbprophet
conda install plotly  # 不安装的话可视化会报错
1.0 以上安装
conda install -c conda-forge prophet
conda install plotly  # 不安装的话可视化会报错
Prophet
Prophet原理图Prophet的大致原理如下,它将一个时间序列看成是三部分的组合:趋势,季节和假日和其他
Prophet对缺失值友好,但对异常值敏感。异常值可设置成None,防止影响模型的拟合。
模型默认线性趋势,但如果数据按照log方式增长的,可调节为growth=”logistic”逻辑回归模型。
当我们预先知道某天会影响数据的整体走势,可以提前将此天设置成转折点(changepoint)。
在设定周期性时,模型默认按照年、星期、天设定,月和小时如需要自行设定。
针对节假日,可通过holiday来进行调节,针对不同的假期,可调整不同的前后窗口期,例如:春节7日
Prophet参数及默认值介绍:
def __init__(self,growth='linear',changepoints=None,n_changepoints=25,changepoint_range=0.8,yearly_seasonality='auto',weekly_seasonality='auto',daily_seasonality='auto',holidays=None,seasonality_mode='additive',seasonality_prior_scale=10.0,holidays_prior_scale=10.0,changepoint_prior_scale=0.05,mcmc_samples=0,interval_width=0.80,uncertainty_samples=1000,stan_backend=None):• growth:趋势函数设置,默认线性“linear”,可选非线性“logistic”。
• changepoints:选择突变点,默认自动选择“None”。 传时间即可 如:["2023-4-15"]
• n_changepoints:突变点个数,默认“25个”。如果changepoints指定,则这个参数就废弃了;如果changepoints没指定,
则会从输入的历史数据前80%中自动选取25个突变点。
• changepoint_range:突变点数据范围,默认“80%”。同样,如果changepoints指定,则这个参数就废弃了。
• changepoint_prior_scale: 调节“changepoints”发现强度,默认“0.05”。值越大对历史数据拟合程度越强,但会增加过拟合的风险。
• yearly_seasonality: 数据是否有年季节性,默认“自动检测”。
• weekly_seasonality: 数据是否有周季节性,默认“自动检测”。
• daily_seasonality: 数据是否有天季节性,默认“自动检测”。
• holidays:指定节假日,默认“None”,支持手动输入指定节假日。以DataFrame格式输入,涵盖:必须列【holiday(string)、ds(date)】、
可选列【lower_window(int)、upper_window(int),指定影响的前后窗口期】。
• seasonality_mode: 季节性效应模式,默认加法模式“additive”,可选“multiplicative”乘法模式。
• seasonality_prior_scale: 调节季节性效应模式强度,默认“10”。值越大,季节性对模型影响越大。
• holidays_prior_scale: 调节节假日模式强度,默认“10”。值越大,节假日对模型影响越大。
模型使用
读取数据将数据处理为ds和y两列
import os
import numpy as np
import pandas as pd
from prophet import Prophet
from prophet.plot import add_changepoints_to_plot
import plotly.express as px
from prophet.plot import plot_plotly, plot_components_plotly, plot_cross_validation_metricdata = pd.read_csv("1_features.csv")
# prophet 时间列叫ds 目标值叫y
data = data.rename(columns={"ts": "ds", "data": "y"})[["ds", "y"]]
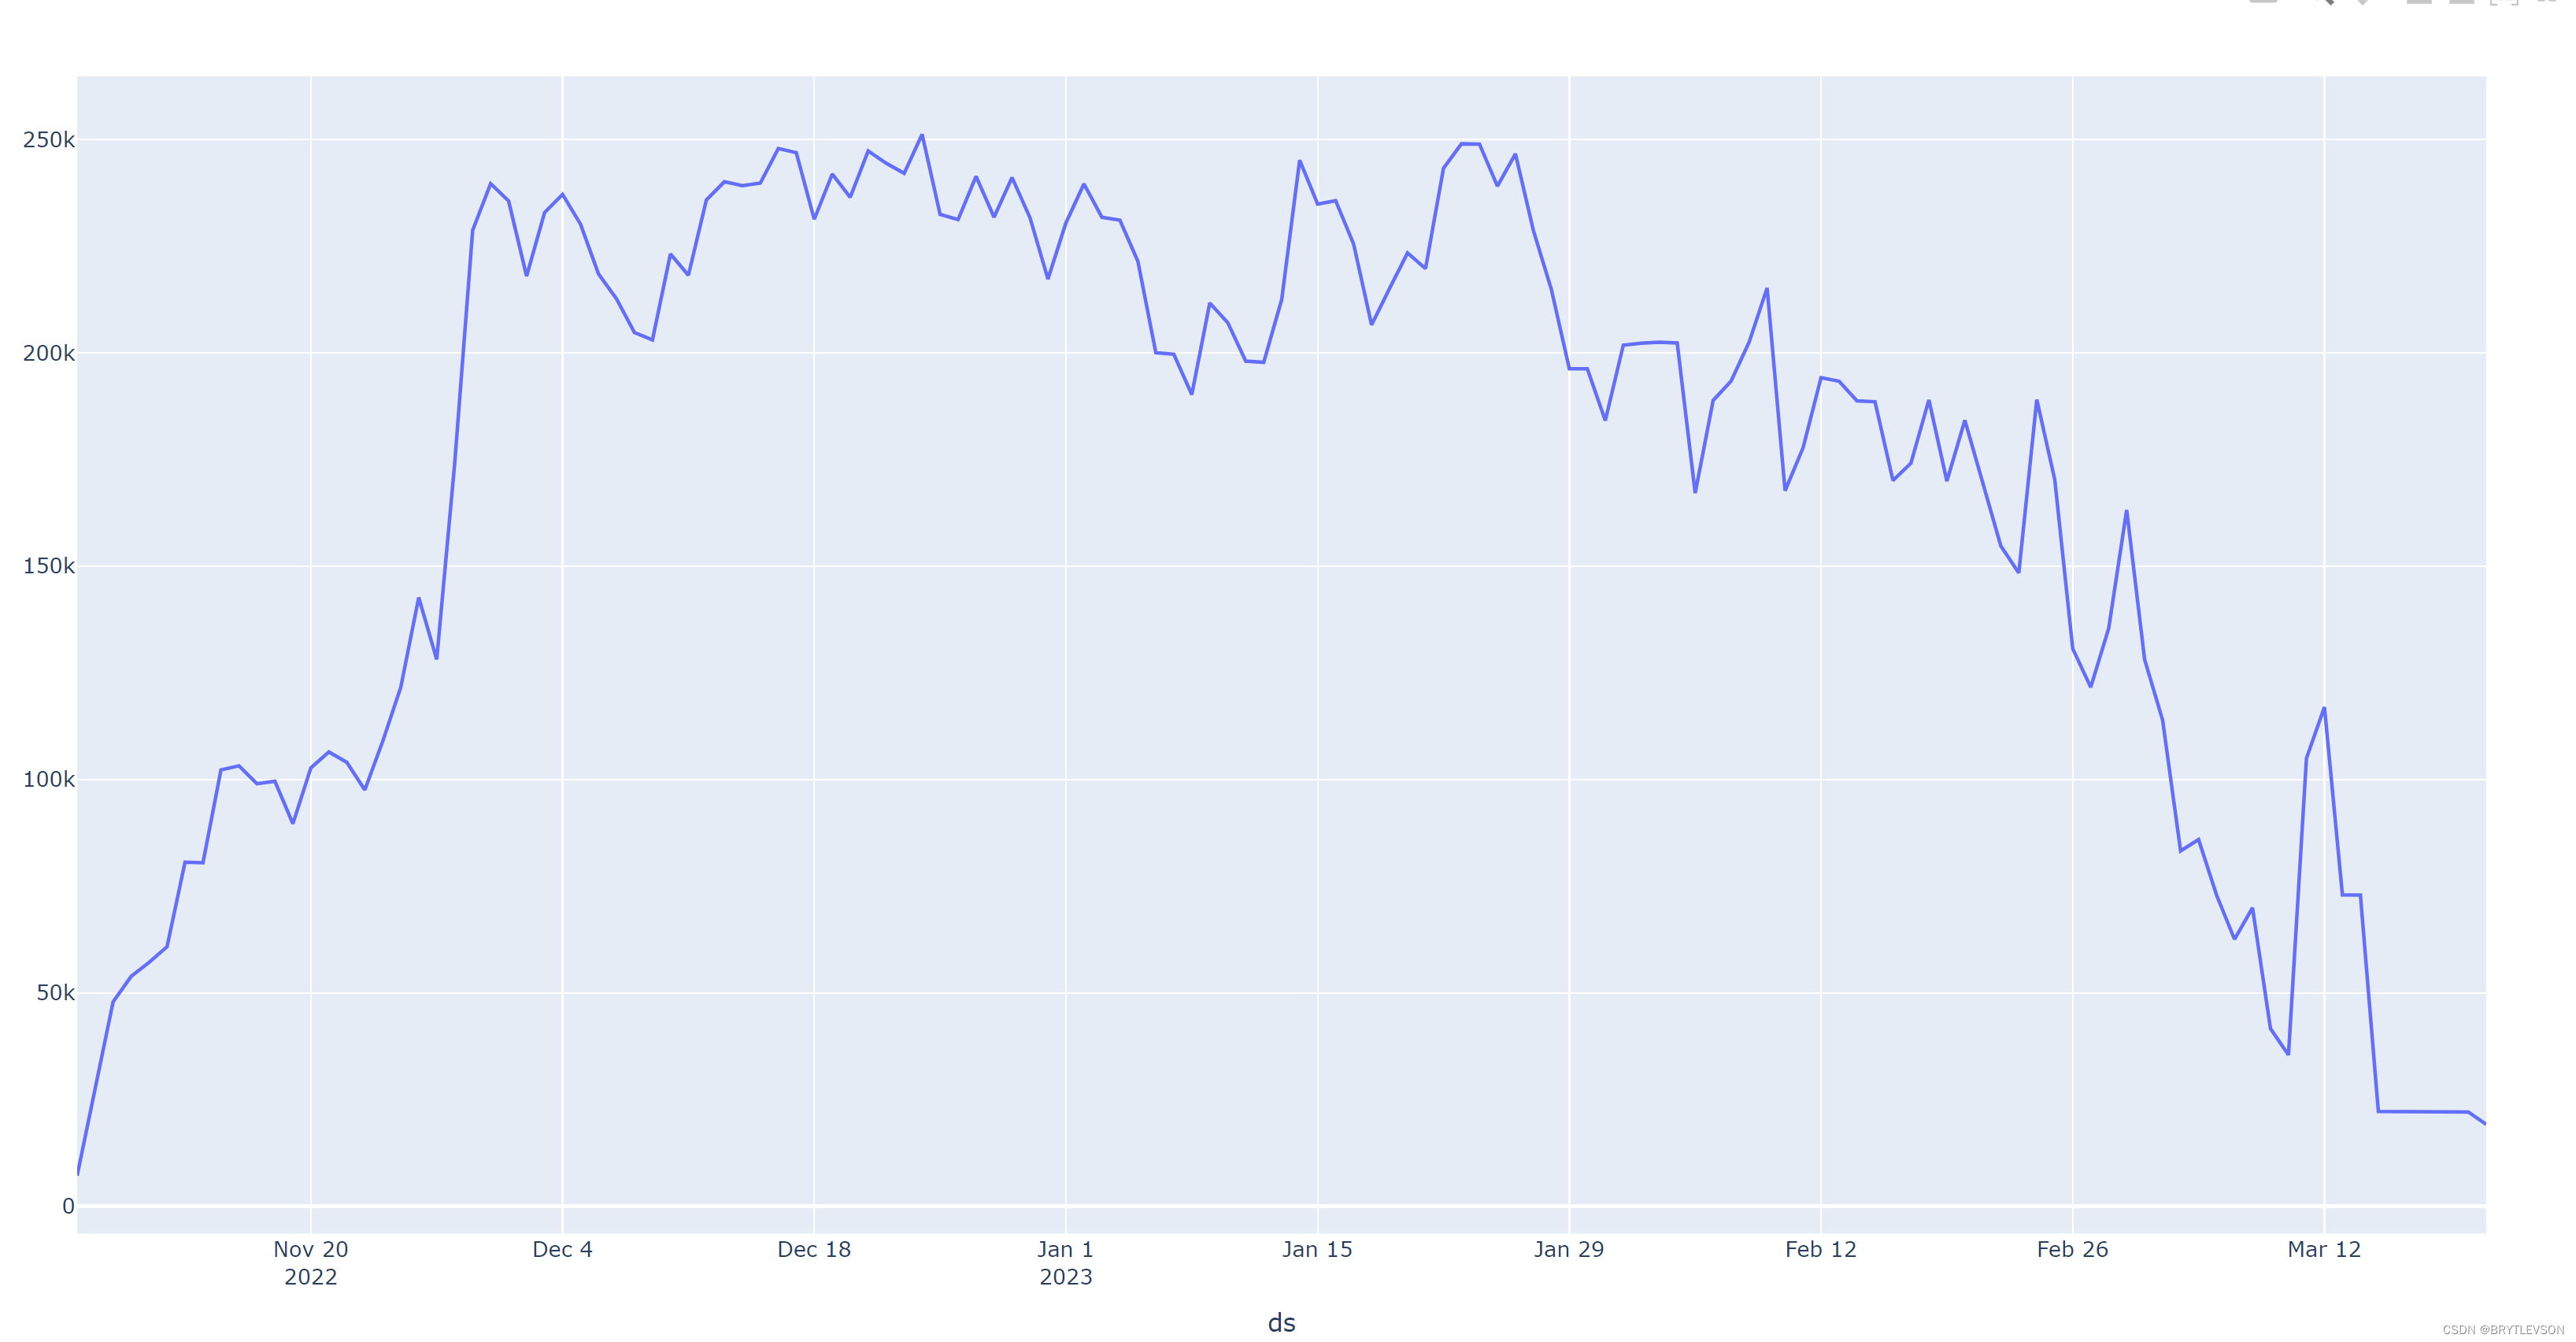
看下数据的分布
fig = px.line(data, x="ds", y="y")
fig.show()
模型训练
# model = Prophet(changepoints=['2022/11/24', '2023/2/25'], yearly_seasonality=True, weekly_seasonality=True, daily_seasonality=True)
model = Prophet()
# 采用中国的假期模式
model.add_country_holidays(country_name="CN")
model.fit(data)
预测
# 模型预测输出预测值、预测上限、预测下限等字段。
future = model.make_future_dataframe(periods=3, include_history=False)
forecast = model.predict(future)
print(forecast)
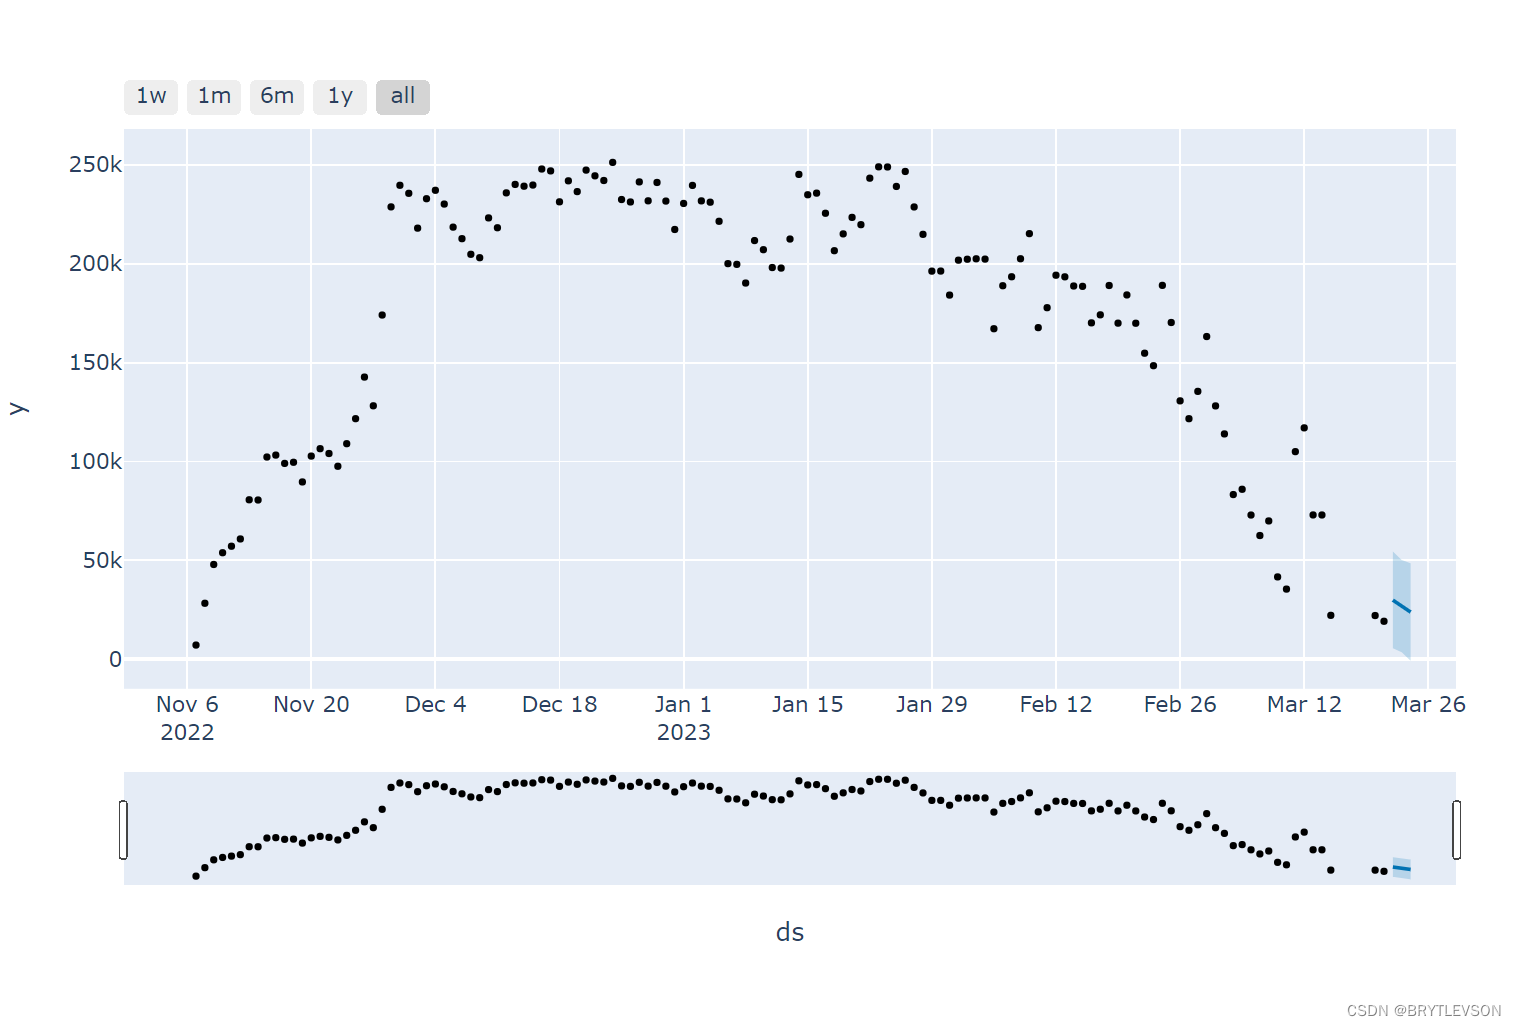
可视化预测结果
## 1.0 版本之前可视化
# fig1 = model.plot(forecast)
# # fig1.savefig('temp1.png')
# 突变点可视化
# add_changepoints_to_plot(fig1.gca(), model, forecast)
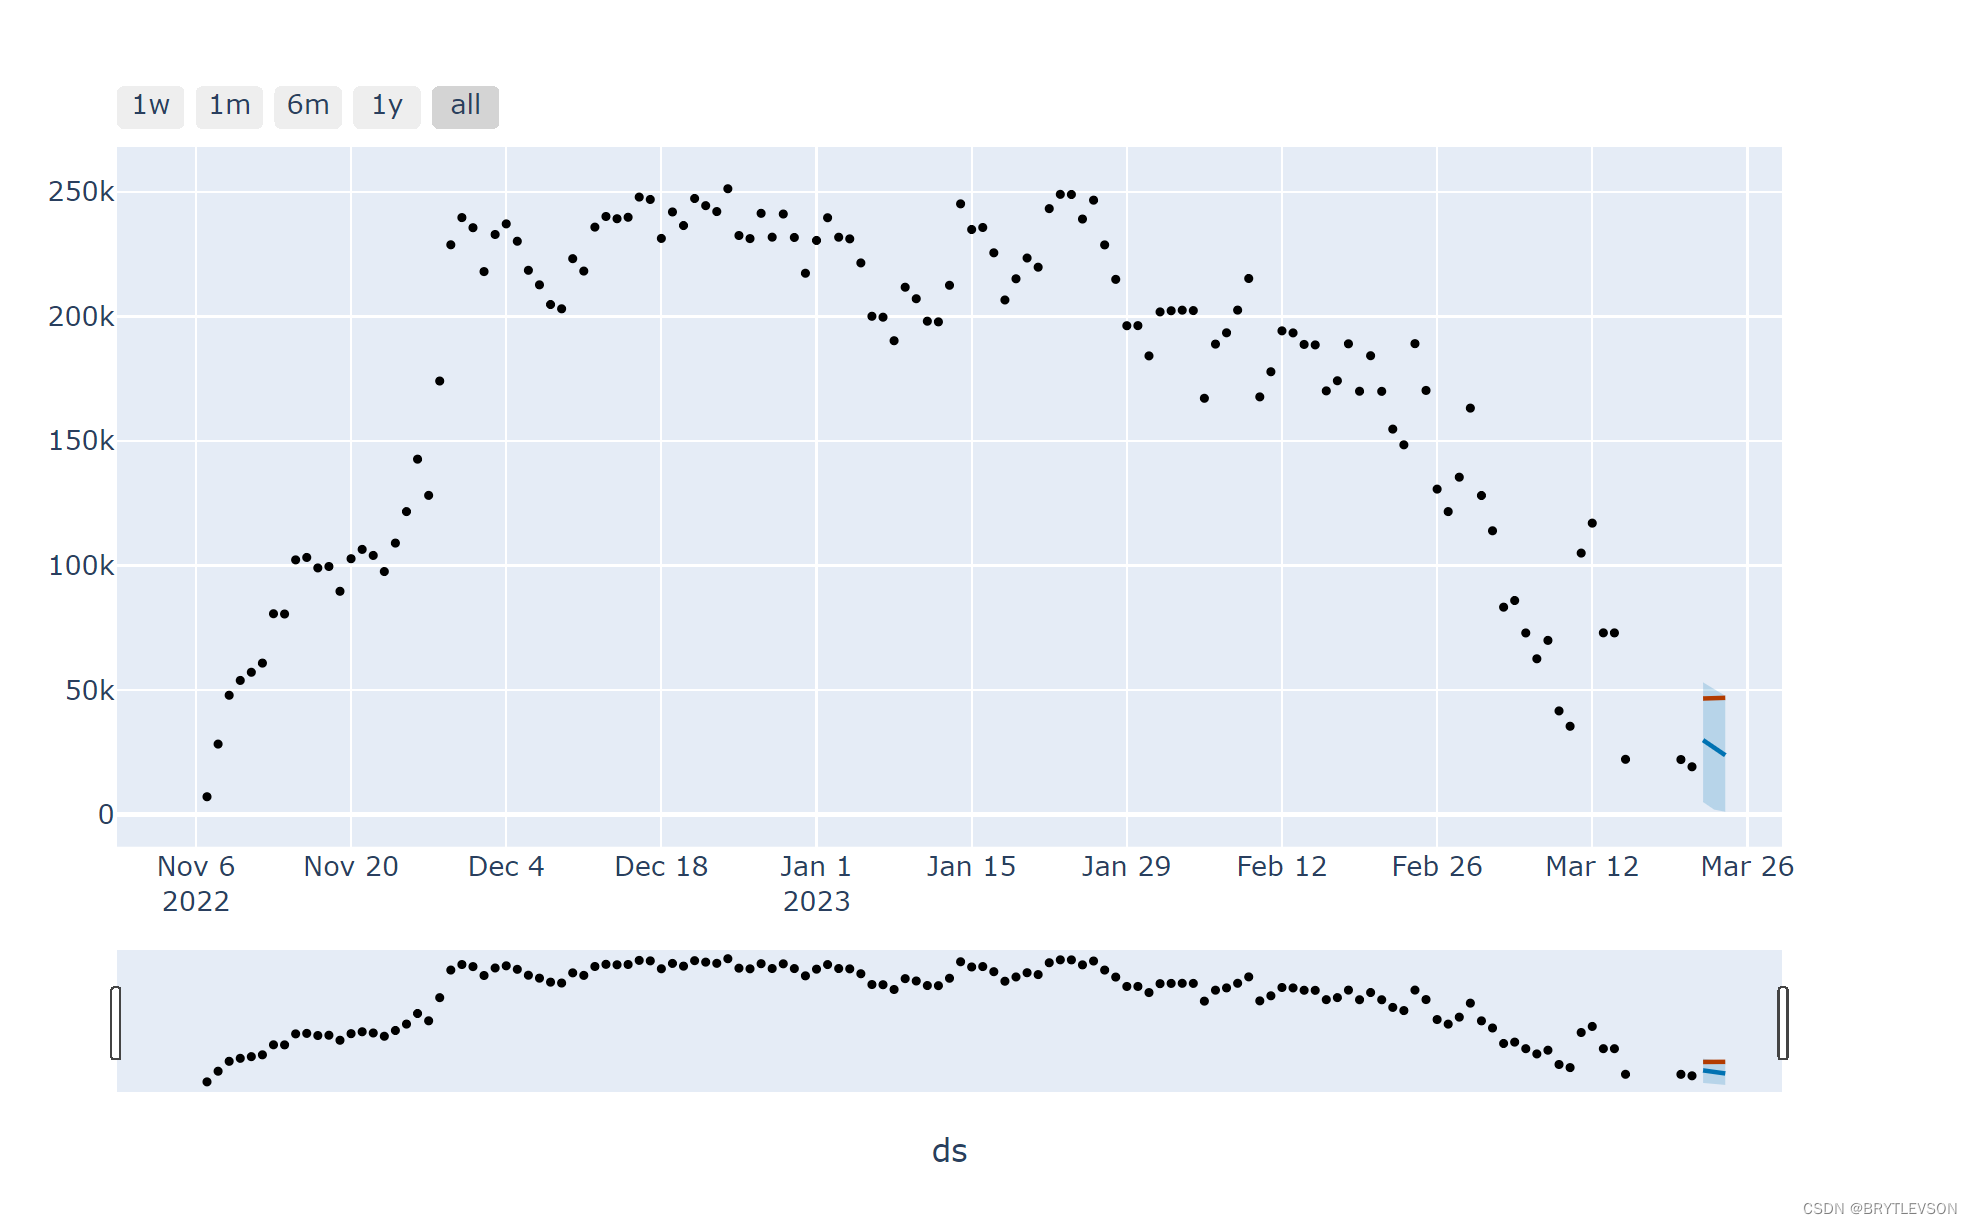
# fig1.show()# 1.0版本之后可视化预测结果
fig = plot_plotly(model, forecast, trend=True)
# 显示突变点
# fig = plot_plotly(model, forecast, trend=True, changepoints=True)
fig.show()
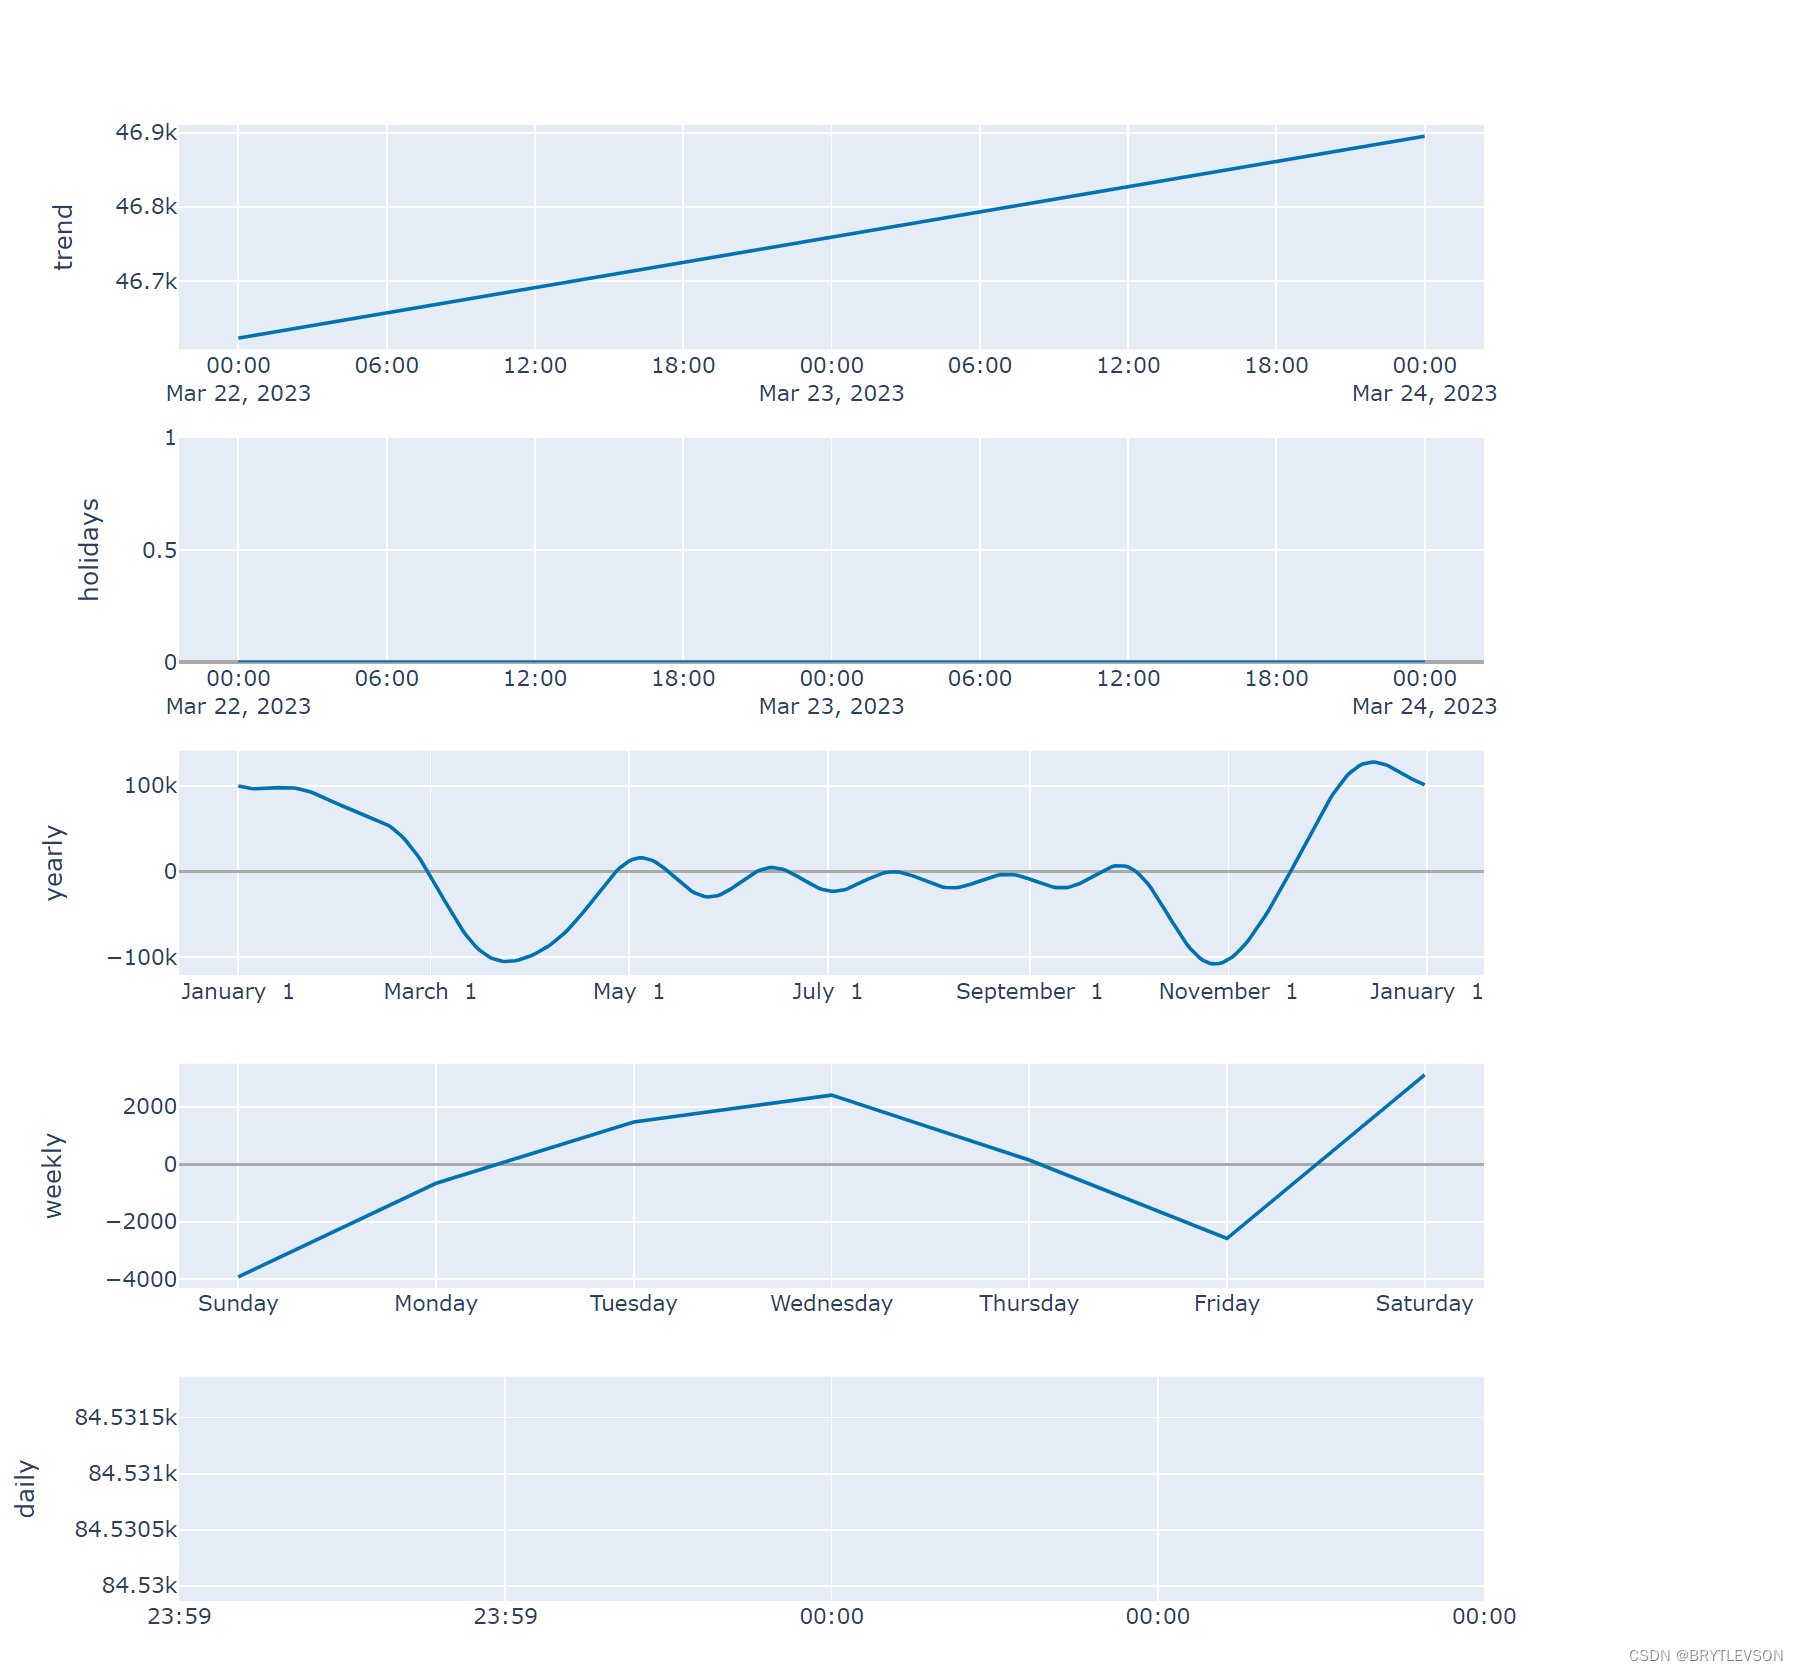
可视化趋势、假期、每周、季节性、年度季节性的回归图
# 可视化趋势、假期、每周、季节性、年度季节性的回归图
fig = plot_components_plotly(model, forecast)
fig.show()
1.0之前模型保存
# 模型保存
with open('prophet_model.json', 'w') as md:json.dump(model_to_json(model), md)# 模型读取
with open('prophet_model.json', 'r') as md:model = model_from_json(json.load(md))