【MATLAB基础绘图第2棒】绘制柱状/饼图填充图

MATLAB绘制柱状填充图
带填充纹理的堆叠图是通过在原始堆叠图的基础上添加不同的纹理得到的,可以很好地解决由于
颜色区分不够而导致的对象识别困难问题。
由于Matlab中未收录提供填充纹理选项,因此需要大家自行设法解决。本博客介绍三种填充方法。
方法1:hatchfill2工具
MATLAB官网-Hatchfill2(Kesh Ikuma. Matlab Central, 2023)
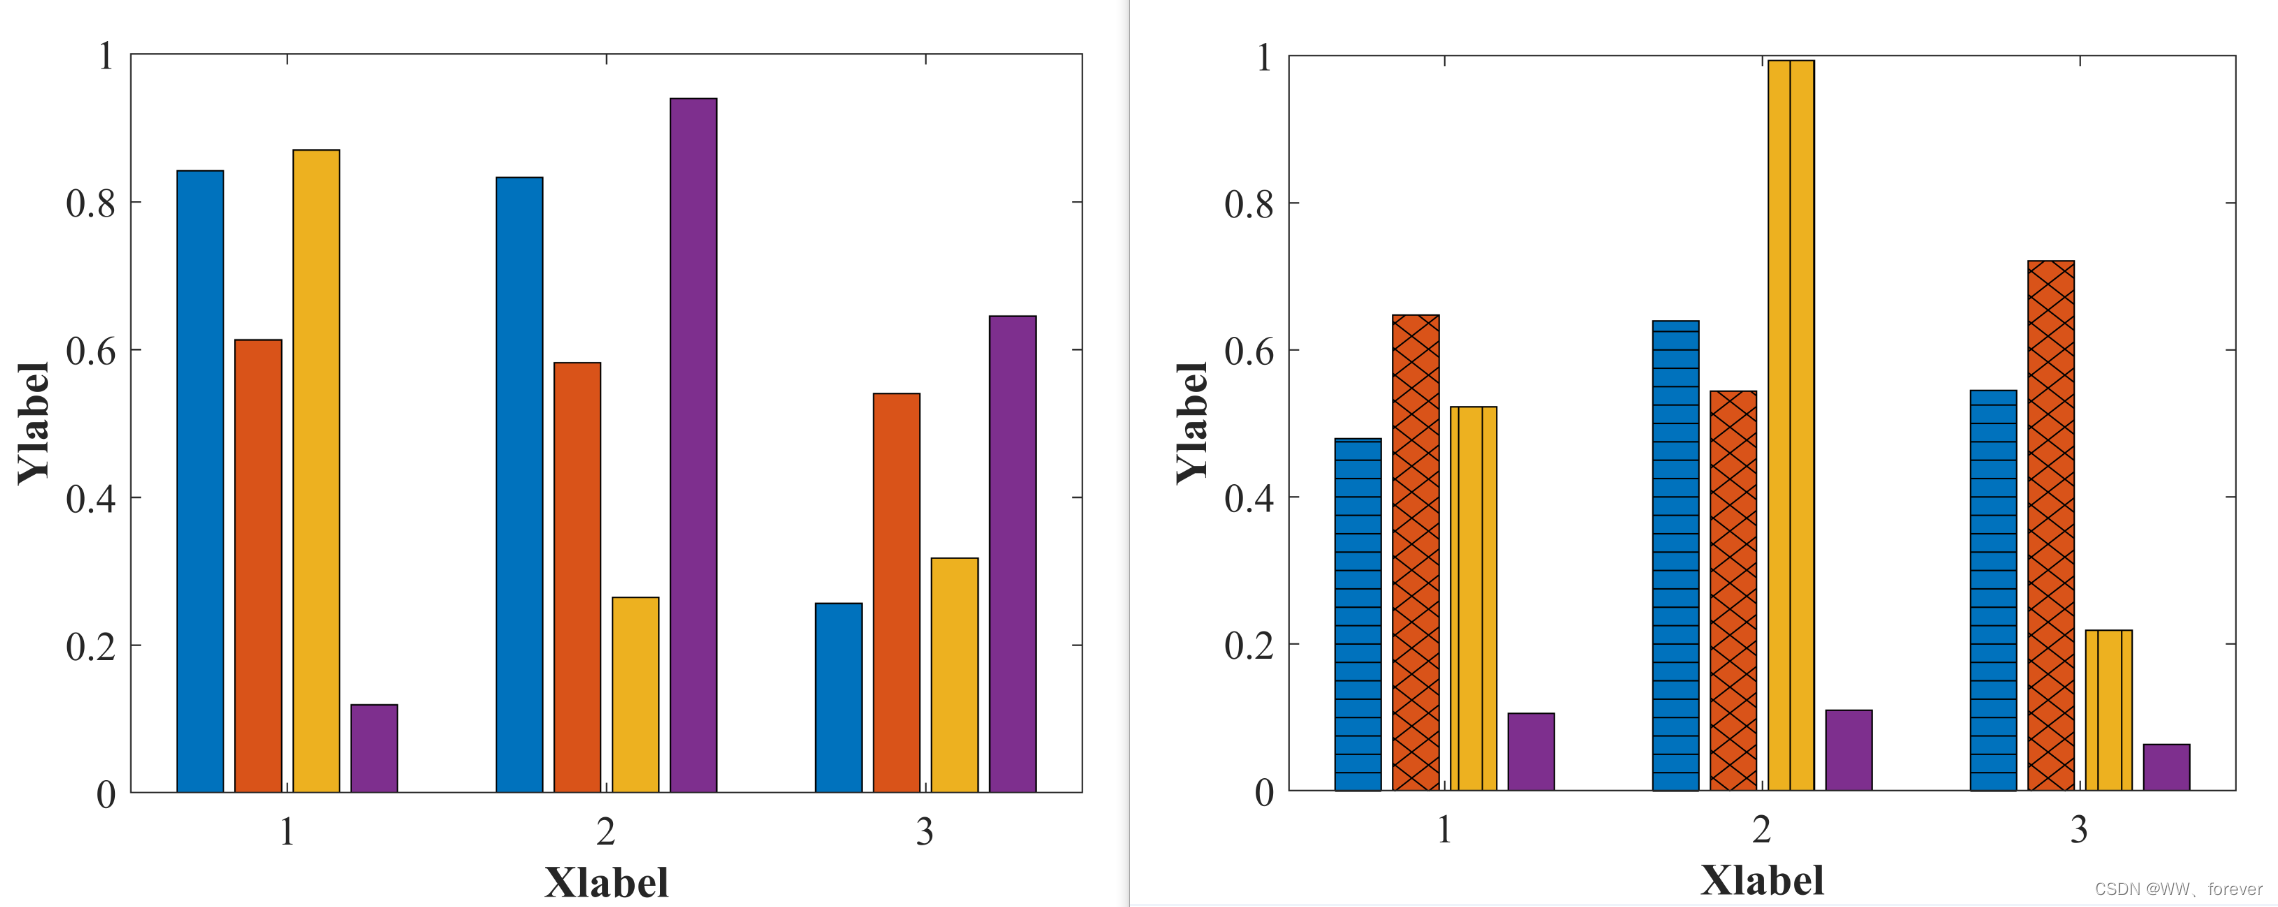
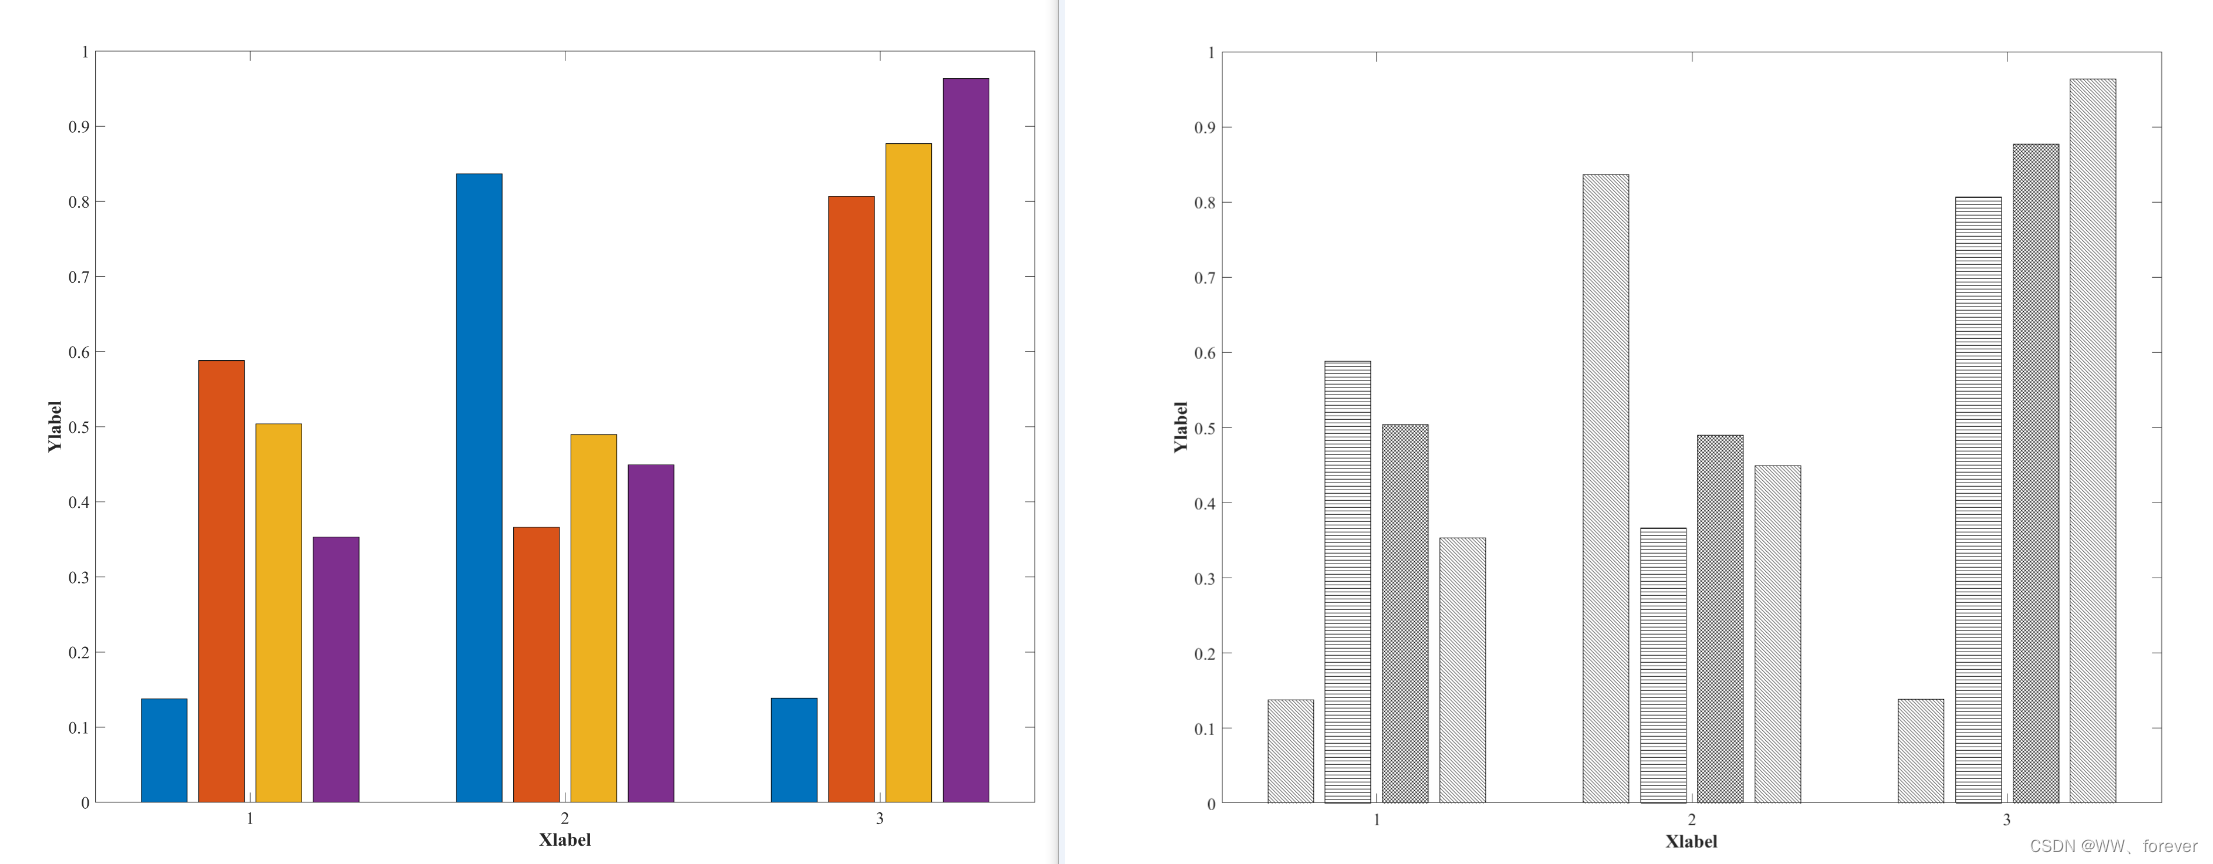
1.1 案例1:柱状图填充
成图如下:
MATLAB代码如下:
clc
close all
clear
%% 基本设置
pathFigure= '.\\Figures\\' ;%% Example 1:柱状图填充figure(1);
h = bar(rand(3,4));
xlabel('Xlabel','fontsize',14,'FontName','Times New Roman','FontWeight','Bold')
ylabel('Ylabel','fontsize',14,'FontName','Times New Roman','FontWeight','Bold')
set(gca,'Layer','top','FontSize',14,'Fontname', 'Times New Roman');str= strcat(pathFigure, "Figure1", '.tiff');
print(gcf, '-dtiff', '-r600', str);figure(2);
hp = bar(rand(3,4));
xlabel('Xlabel','fontsize',14,'FontName','Times New Roman','FontWeight','Bold')
ylabel('Ylabel','fontsize',14,'FontName','Times New Roman','FontWeight','Bold')
set(gca,'Layer','top','FontSize',14,'Fontname', 'Times New Roman');
hatchfill2(hp(1),'single','HatchAngle',0);
hatchfill2(hp(2),'cross','HatchAngle',45);
hatchfill2(hp(3),'single','HatchAngle',90);str= strcat(pathFigure, "Figure2", '.tiff');
print(gcf, '-dtiff', '-r600', str);
此外,也可以尝试黑白配色(FaceColor设置为白色即可):
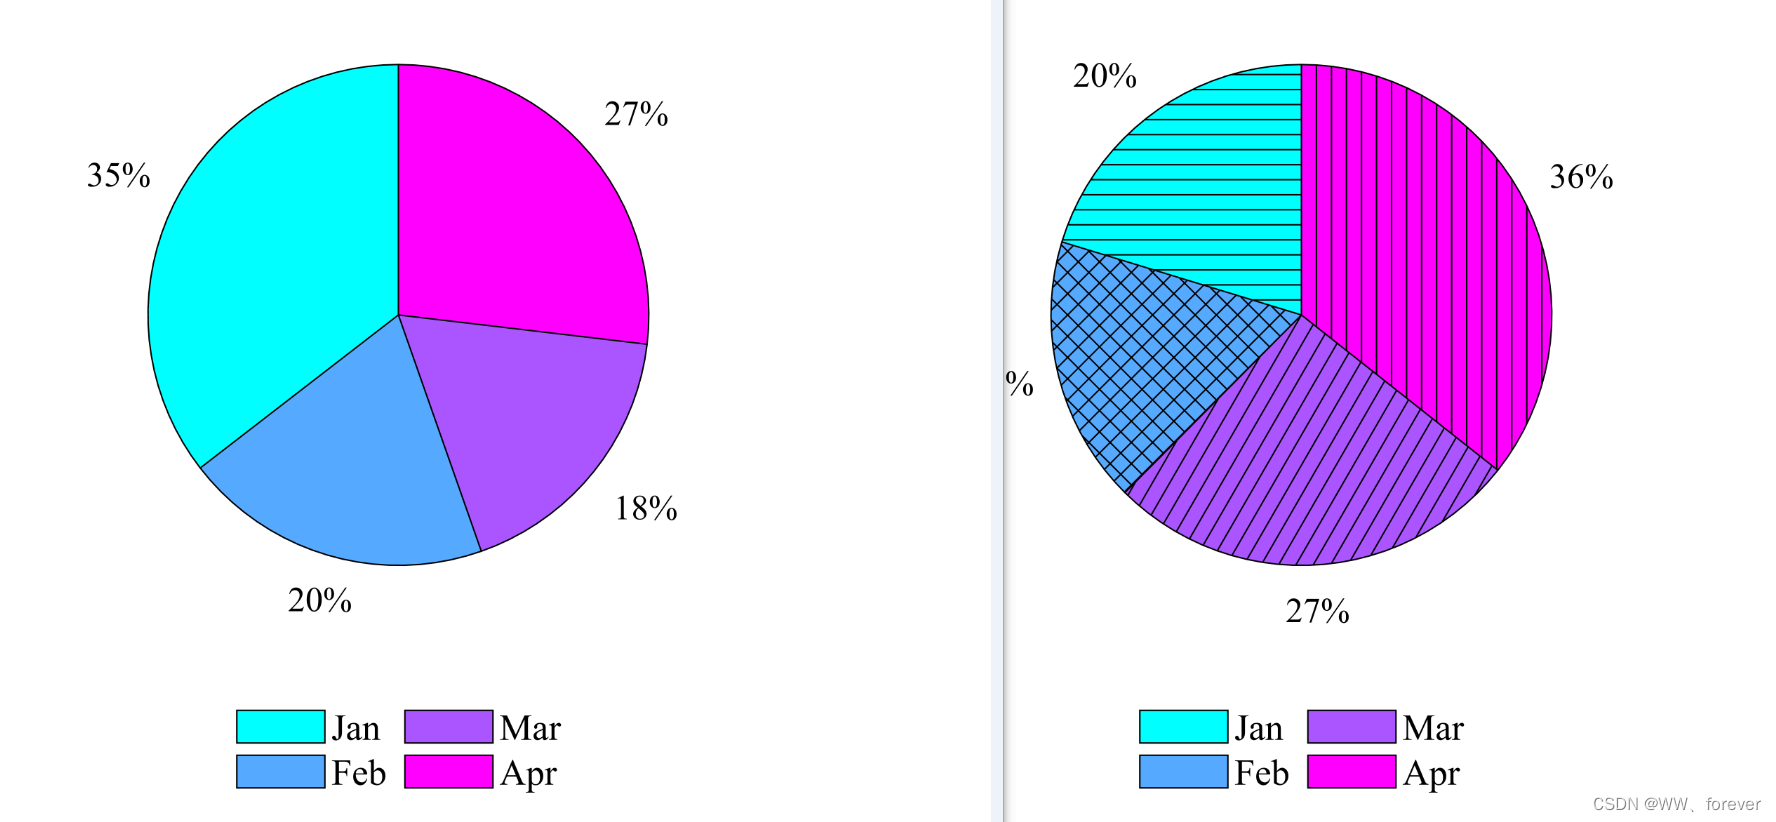
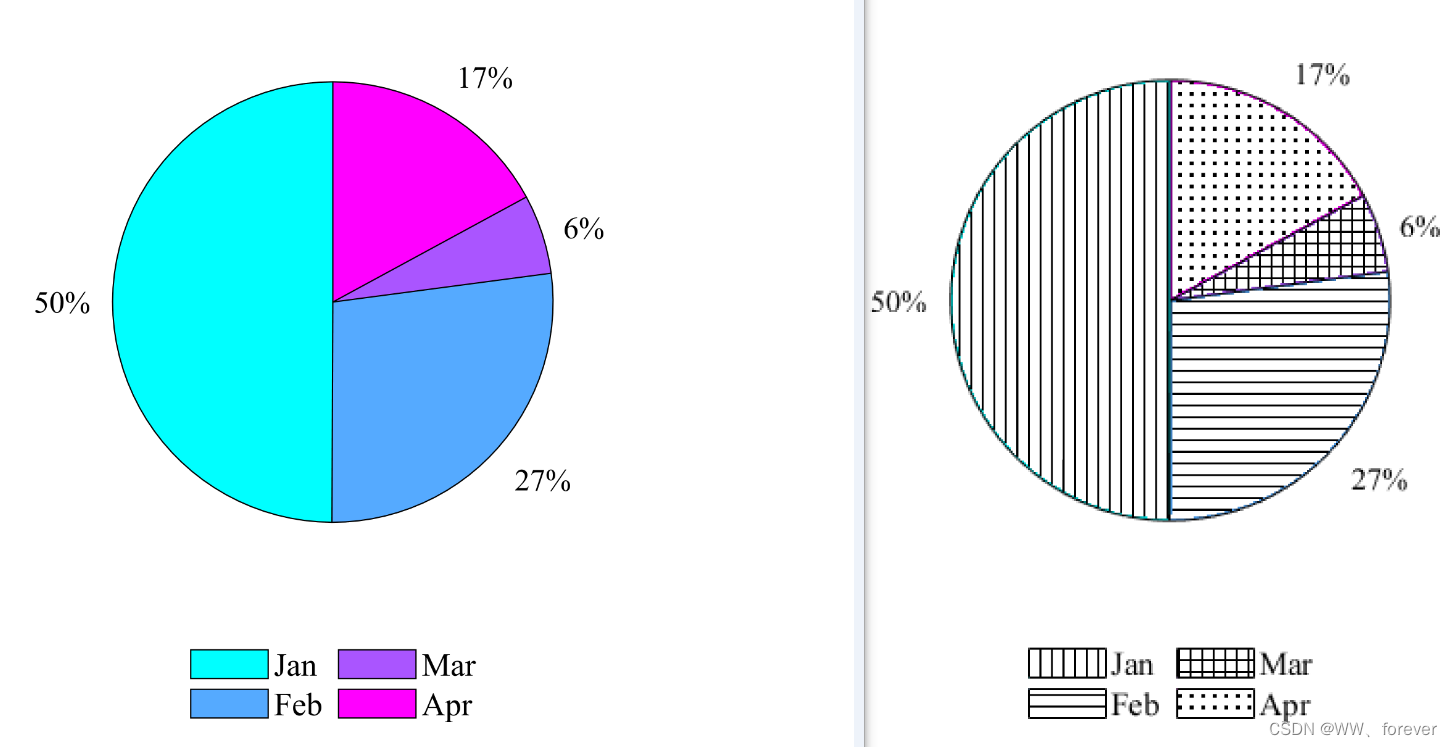
1.2 案例2:饼图填充
成图如下:
MATLAB代码如下:
clc
close all
clear
%% 基本设置
pathFigure= '.\\Figures\\' ;%% Example 2:饼图填充figure(3);
colormap(cool(4));
h = pie(rand(4,1));
th = findobj(gca, 'Type', 'text');
set(th, 'FontName', 'Times New Roman', 'FontSize', 12)
hl = legend('Jan','Feb','Mar','Apr','May','Jun');
set(hl,'Box','off','Location','southOutside','NumColumns',3);
set(gca,'Layer','top','FontSize',14,'Fontname', 'Times New Roman');str= strcat(pathFigure, "Figure3", '.tiff');
print(gcf, '-dtiff', '-r600', str);figure(4);
colormap(cool(4));
hp = pie(rand(4,1));
hatchfill2(hp(1,1),'single','HatchAngle',0);
hatchfill2(hp(1,3),'cross','HatchAngle',45);
hatchfill2(hp(1,5),'single','HatchAngle',60);
hatchfill2(hp(1,7),'single','HatchAngle',90);
th = findobj(gca, 'Type', 'text');
set(th, 'FontName', 'Times New Roman', 'FontSize', 12)
hl = legend(hp(1, [1,3,5,7]),'Jan','Feb','Mar','Apr');
set(hl,'Box','off','Location','southOutside','NumColumns',3);
set(gca,'Layer','top','FontSize',14,'Fontname', 'Times New Roman');str= strcat(pathFigure, "Figure4", '.tiff');
print(gcf, '-dtiff', '-r600', str);
方法2:applyhatch函数
Documentation of applyhatch
调用函数如下:
function applyhatch(h,patterns,colorlist)
% APPLYHATCH Apply hatched patterns to a figure
%  APPLYHATCH(H,PATTERNS) creates a new figure from the figure H by
%  replacing distinct colors in H with the black and white
%  patterns in PATTERNS. The format for PATTERNS can be
%    a string of the characters '/', '\\', '|', '-', '+', 'x', '.'
%    a cell array of matrices of zeros (white) and ones (black)
%
%  APPLYHATCH(H,PATTERNS,COLORS) maps the colors in the n by 3
%  matrix COLORS to PATTERNS. Each row of COLORS specifies an RGB
%  color value.
%
%  Note this function makes a bitmap image of H and so is limited
%  to low-resolution, bitmap output.
%
%  Example 1:
%    bar(rand(3,4));
%    applyhatch(gcf,'\\-x.');
%
%  Example 2:
%    colormap(cool(6));
%    pie(rand(6,1));
%    legend('Jan','Feb','Mar','Apr','May','Jun');
%    applyhatch(gcf,'|-+.\\/',cool(6));
%
%  See also: MAKEHATCH%  Copyright 2002-2009 The MathWorks, Inc.oldppmode = get(h,'paperpositionmode');  % 文件位置模式
oldunits = get(h,'units');
set(h,'paperpositionmode','auto');
set(h,'units','pixels');
figsize = get(h,'position');
if nargin == 2colorlist = [];
end
if verLessThan('matlab','8.4.0')bits = hardcopy(h,'-dzbuffer','-r0');
elsebits = print(h,'-RGBImage','-r0');
end
set(h,'paperpositionmode',oldppmode);bwidth = size(bits,2);
bheight = size(bits,1);
bsize = bwidth * bheight;
if ~isempty(colorlist)colorlist = uint8(255*colorlist);[colors,colori] = nextnonbw(0,colorlist,bits);
elsecolors = (bits(:,:,1) ~= bits(:,:,2)) | ...(bits(:,:,1) ~= bits(:,:,3));
end
pati = 1;
colorind = find(colors);
while ~isempty(colorind)colorval(1) = bits(colorind(1));colorval(2) = bits(colorind(1)+bsize);colorval(3) = bits(colorind(1)+2*bsize);if iscell(patterns)pattern = patterns{pati};elseif isa(patterns,'char')pattern = makehatch(patterns(pati));elsepattern = patterns;endpattern = uint8(255*(1-pattern));pheight = size(pattern,2);pwidth = size(pattern,1);ratioh = ceil(bheight/pheight);ratiow = ceil(bwidth/pwidth);bigpattern = repmat(pattern,[ratioh ratiow]);if ratioh*pheight > bheightbigpattern(bheight+1:end,:) = [];endif ratiow*pwidth > bwidthbigpattern(:,bwidth+1:end) = [];endbigpattern = repmat(bigpattern,[1 1 3]);color = (bits(:,:,1) == colorval(1)) & ...(bits(:,:,2) == colorval(2)) & ...(bits(:,:,3) == colorval(3));color = repmat(color,[1 1 3]);bits(color) = bigpattern(color);if ~isempty(colorlist)[colors,colori] = nextnonbw(colori,colorlist,bits);elsecolors = (bits(:,:,1) ~= bits(:,:,2)) | ...(bits(:,:,1) ~= bits(:,:,3));endcolorind = find(colors);pati = (pati + 1);if pati > length(patterns)pati = 1;end
endnewfig = figure('units','pixels','visible','off');
imaxes = axes('parent',newfig,'units','pixels');
im = image(bits,'parent',imaxes);
fpos = get(newfig,'position');
set(newfig,'position',[fpos(1:2) figsize(3) figsize(4)+1]);
set(imaxes,'position',[0 0 figsize(3) figsize(4)+1],'visible','off');
set(newfig,'visible','on');
endfunction [colors,out] = nextnonbw(ind,colorlist,bits)
out = ind+1;
colors = [];while out <= size(colorlist,1)if isequal(colorlist(out,:),[255 255 255]) | ...isequal(colorlist(out,:),[0 0 0])out = out+1;elsecolors = (colorlist(out,1) == bits(:,:,1)) & ...(colorlist(out,2) == bits(:,:,2)) & ...(colorlist(out,3) == bits(:,:,3));returnend
endendfunction A = makehatch(hatch)
%MAKEHATCH Predefined hatch patterns
%  MAKEHATCH(HATCH) returns a matrix with the hatch pattern for HATCH
%   according to the following table:
%      HATCH        pattern
%     -------      ---------
%        /          right-slanted lines
%        \\          left-slanted lines
%        |          vertical lines
%        -          horizontal lines
%        +          crossing vertical and horizontal lines
%        x          criss-crossing lines
%        .          single dots
%
%  See also: APPLYHATCH%  Copyright 2002-2009 The MathWorks, Inc.n = 6;
A=zeros(n);
switch (hatch)case '/'A = fliplr(eye(n));case '\\'A = eye(n);case '|'A(:,1) = 1;case '-'A(1,:) = 1;case '+'A(:,1) = 1;A(1,:) = 1;case 'x'A = eye(n) | fliplr(diag(ones(n-1,1),-1));case '.'A(1:2,1:2)=1;otherwiseerror(['Undefined hatch pattern "' hatch '".']);
endend
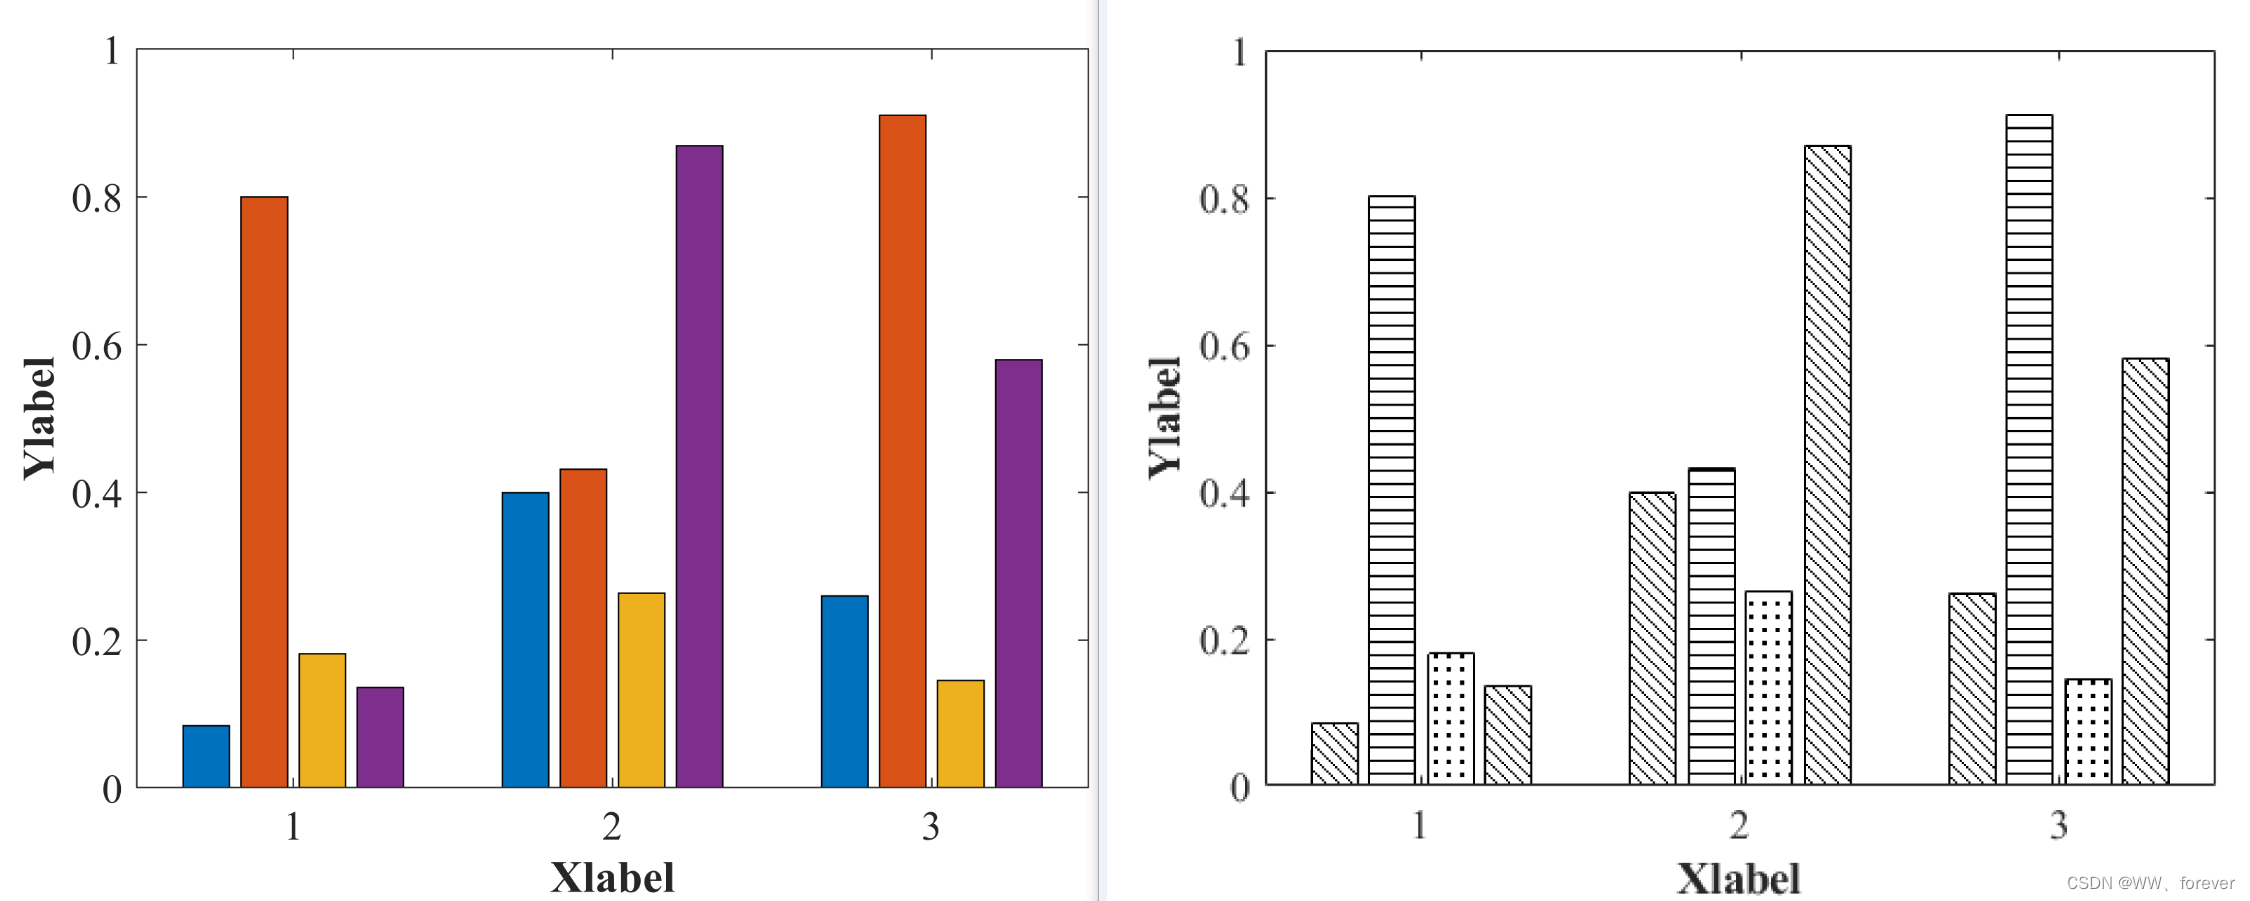
2.1 案例1:柱状图填充
成图如下:
MATLAB代码如下:
clc
close all
clear
%% 基本设置
pathFigure= '.\\Figures\\' ;%% Example 1:figure(1);
h = bar(rand(3,4));
xlabel('Xlabel','fontsize',14,'FontName','Times New Roman','FontWeight','Bold')
ylabel('Ylabel','fontsize',14,'FontName','Times New Roman','FontWeight','Bold')
set(gca,'Layer','top','FontSize',14,'Fontname', 'Times New Roman');
str= strcat(pathFigure, "Figure1", '.tiff');
print(gcf, '-dtiff', '-r600', str);applyhatch(gcf,'\\-x.');
set(gca,'Layer','top','FontSize',14,'Fontname', 'Times New Roman');str= strcat(pathFigure, "Figure2", '.tiff');
print(gcf, '-dtiff', '-r600', str);
2.2 案例2:饼图填充
成图如下:
MATLAB代码如下:
clc
close all
clear
%% 基本设置
pathFigure= '.\\Figures\\' ;%% Example 2:figure(3);
colormap(cool(4));
h = pie(rand(4,1));
th = findobj(gca, 'Type', 'text');
set(th, 'FontName', 'Times New Roman', 'FontSize', 12)
hl = legend('Jan','Feb','Mar','Apr','May','Jun');
set(hl,'Box','off','Location','southOutside','NumColumns',3);
set(gca,'Layer','top','FontSize',14,'Fontname', 'Times New Roman');str= strcat(pathFigure, "Figure3", '.tiff');
print(gcf, '-dtiff', '-r600', str);applyhatch(gcf,'|-+.', cool(4));
set(gca,'Layer','top','FontSize',14,'Fontname', 'Times New Roman');str= strcat(pathFigure, "Figure4", '.tiff');
print(gcf, '-dtiff', '-r600', str);
方法3: applyhatch_plusC函数
MATLAB官网-applyhatch_plusC函数
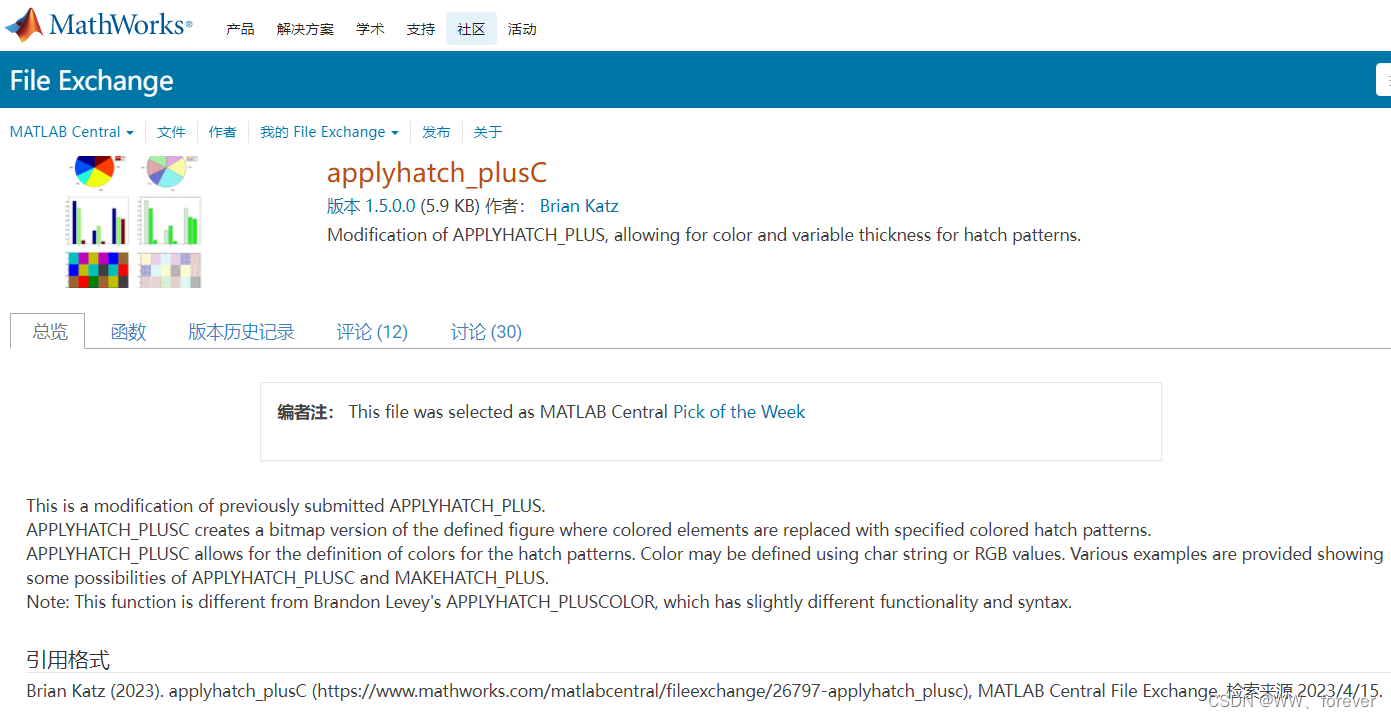
但是问题来了,在较新版本(如R2019a)的matlab中将applyhatch函数中用到的hardcopy函数去掉了,会提示 “未定义函数或变量 ‘hardcopy’”错误。
一个简单的解决方案是将以下代码进行替换:
bits = hardcopy(h,'-dzbuffer',['-r' num2str(dpi)]);
bits = print('-RGBImage');
但是最后的结果很差,图像失真很严重,并且不能调整。因此并不建议用此函数。
3.1 案例1:柱状图填充
成图如下:
MATLAB代码如下:
clc
close all
clear
%% 基本设置
pathFigure= '.\\Figures\\' ;% 图片尺寸设置(单位:厘米)
% ----------------------------------------------
figureUnits = 'centimeters';
figureWidth = 35;
figureHeight = 30;%% Example 1:柱状图填充figureHandle = figure;
set(gcf, 'Units', figureUnits, 'Position', [0 0 figureWidth figureHeight]); % define the new figure dimensions
h = bar(rand(3,4));
xlabel('Xlabel','fontsize',14,'FontName','Times New Roman','FontWeight','Bold')
ylabel('Ylabel','fontsize',14,'FontName','Times New Roman','FontWeight','Bold')
set(gca,'Layer','top','FontSize',14,'Fontname', 'Times New Roman');str= strcat(pathFigure, "Figure1", '.tiff');
print(gcf, '-dtiff', '-r600', str);[im_hatch1,colorlist] = applyhatch_pluscolor(gcf,'\\-x.',0,0,[],150);str= strcat(pathFigure, "Figure2", '.tiff');
print(gcf, '-dtiff', '-r600', str);
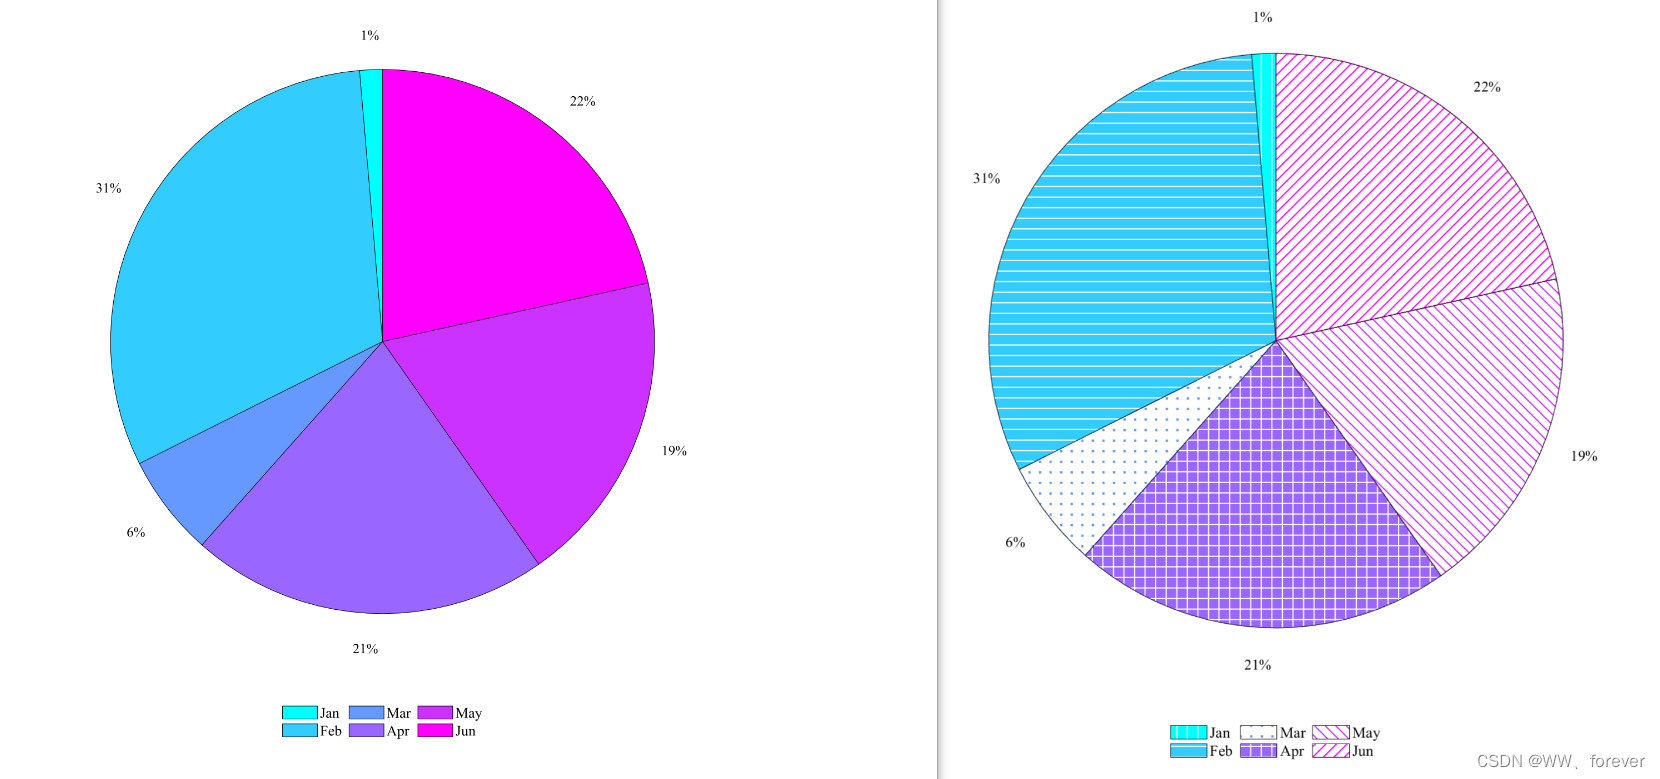
3.2 案例2:饼图填充
成图如下:
MATLAB代码如下:
clc
close all
clear
%% 基本设置
pathFigure= '.\\Figures\\' ;% 图片尺寸设置(单位:厘米)
% ----------------------------------------------
figureUnits = 'centimeters';
figureWidth = 35;
figureHeight = 30;
%% Example 2:饼图填充figureHandle = figure;
set(gcf, 'Units', figureUnits, 'Position', [0 0 figureWidth figureHeight]); % define the new figure dimensions
colormap(cool(6));
h = pie(rand(6,1));
th = findobj(gca, 'Type', 'text');
set(th, 'FontName', 'Times New Roman', 'FontSize', 12)
hl = legend('Jan','Feb','Mar','Apr','May','Jun');
set(hl,'Box','off','Location','southOutside','NumColumns',3);
set(gca,'Layer','top','FontSize',14,'Fontname', 'Times New Roman');str= strcat(pathFigure, "Figure3", '.tiff');
print(gcf, '-dtiff', '-r600', str);im_hatch2 = applyhatch_pluscolor(gcf,'|-.+\\/',1,[1 1 0 1 0 0],cool(6),200,3,2);str= strcat(pathFigure, "Figure4", '.tiff');
print(gcf, '-dtiff', '-r600', str);
参考
1.CSDN博客-matlab画柱状图并填充
2.CSDN博客-matlab画条纹填充(Hatched Fill)图 填坑 applyhatch hardcopy