【MATLAB基础绘图第8棒】绘制局部放大图

MATLAB绘制局部放大图
1 工具准备
MATLAB官网-ZoomPlot(Kepeng Qiu. Matlab Central, 2022)

初始数据图绘制完成后,调用以下代码:
%% 添加局部放大
zp = BaseZoom();
zp.plot;
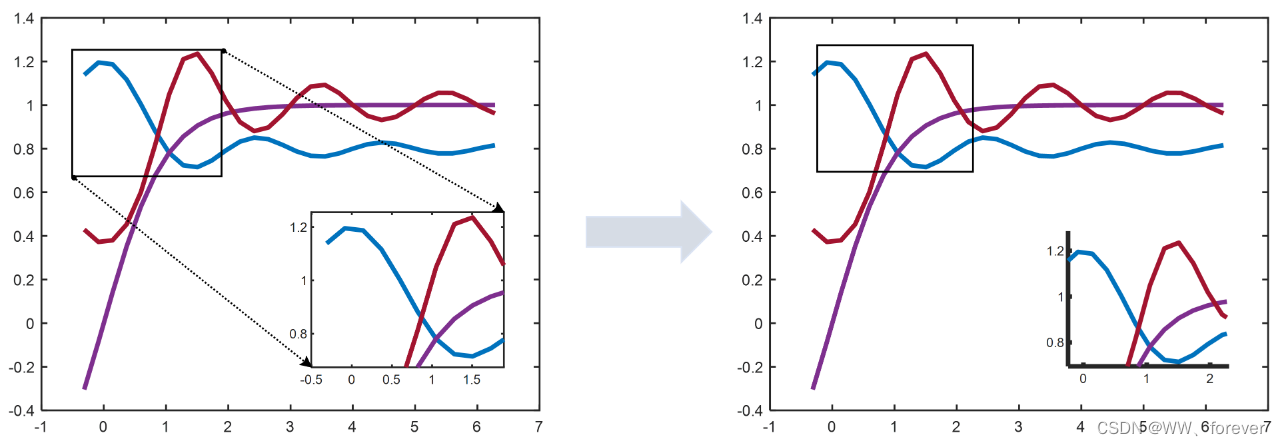
1.1 具体绘制步骤
具体绘制步骤如下:
- 通过鼠标左键框选作图区域;
- 鼠标右键确定后,通过鼠标左键框选需要放大的区域;
- 鼠标右键确定后,完成局部放大图的绘制。
1.2 子坐标系(sub-coordinate system)设置
子坐标系(sub-coordinate system)默认设置:
% theme of inserted axes (sub-axes)propertiessubAxesBox = 'on'subAxesinsertedLineWidth = 1.2subAxesTickDirection = 'in'subAxesBackgroundColor = 'w'end
例:去除子坐标系并设置线宽为3,具体代码如下:
% theme of inserted axes (sub-axes)propertiessubAxesBox = 'off'subAxesinsertedLineWidth = 3subAxesTickDirection = 'in'subAxesBackgroundColor = 'w'end
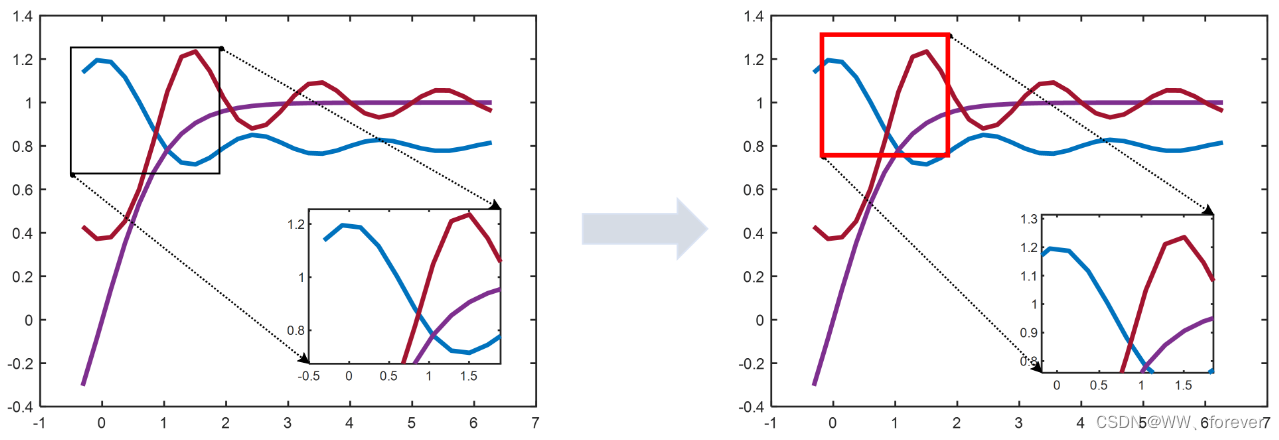
1.3 放大区域(the zoomed zone)设置
放大区域(the zoomed zone)默认设置:
% theme of the zoomed zone (figures)propertiesrectangleColor = 'k'rectangleFaceColor = 'none'rectangleFaceAlpha = 0rectangleLineStyle = '-'rectangleLineWidth = 1.2rectangleInteractionsAllowed = 'none'end
例:设置放大区域线条颜色及线宽为2,具体代码如下:
% theme of the zoomed zone (figures)propertiesrectangleColor = 'r'rectangleFaceColor = 'none'rectangleFaceAlpha = 0rectangleLineStyle = '-'rectangleLineWidth = 2rectangleInteractionsAllowed = 'none'end
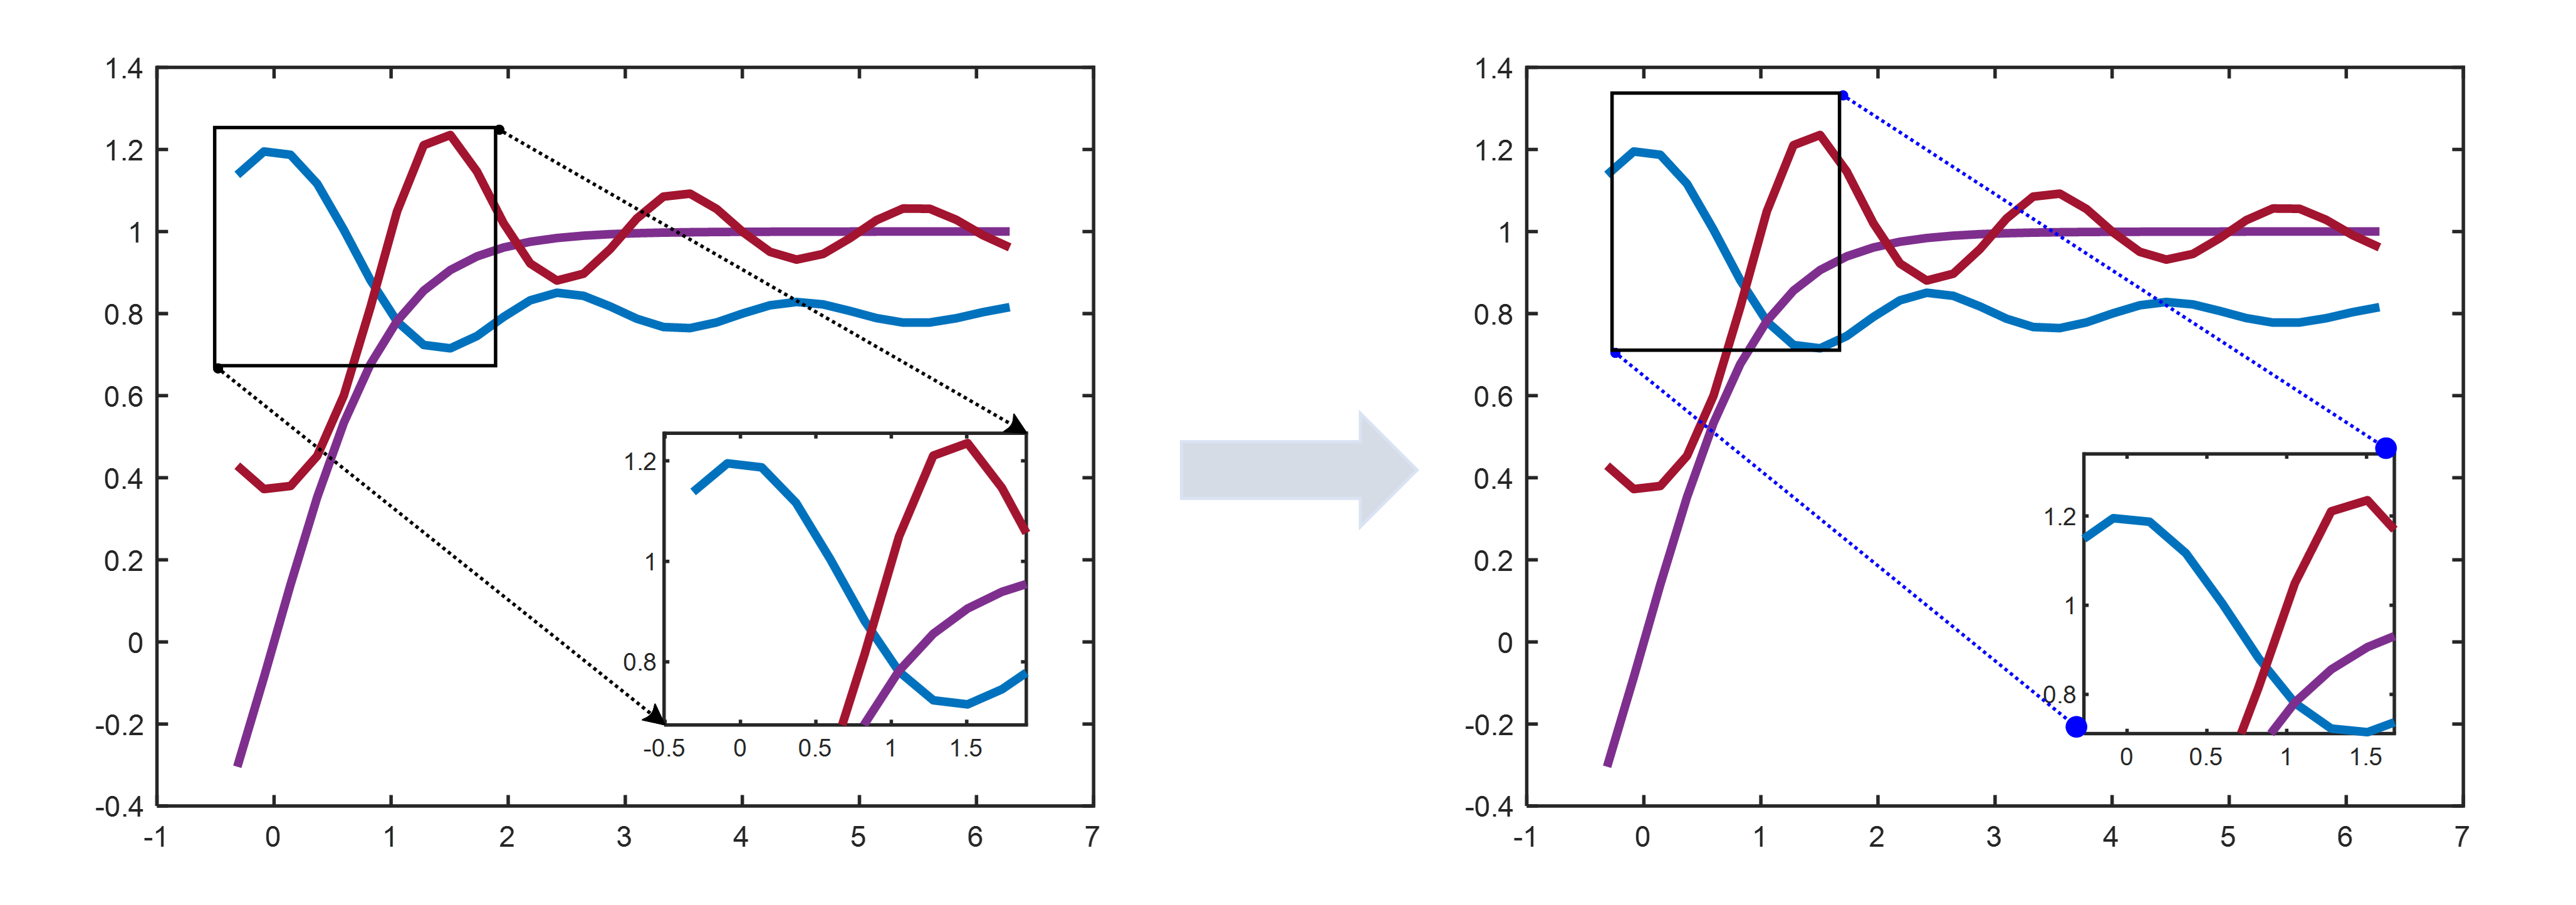
1.4 连接线(the connected lines)设置
连接线(the connected lines)默认设置:
% theme of the connected lines (figures)properties% setting of lines between arrowsfigureConnectedLineStyle = ':'figureConnectedLineColor = 'k'figureConnectedLineWidth = 1.2% setting of start arrowfigureConnectedLineStartHeadStyle = 'ellipse' % shape of start arrowfigureConnectedLineStartHeadLength = 3figureConnectedLineStartHeadWidth = 3% setting of end arrowfigureConnectedLineEndHeadStyle = 'cback2' % shape of ending arrowfigureConnectedLineEndHeadLength = 7figureConnectedLineEndHeadWidth = 7end
例:设置箭头末端形状及颜色,具体代码如下:
% theme of the connected lines (figures)properties% setting of lines between arrowsfigureConnectedLineStyle = ':'figureConnectedLineColor = 'r'figureConnectedLineWidth = 1.2% setting of start arrowfigureConnectedLineStartHeadStyle = 'ellipse' % shape of start arrowfigureConnectedLineStartHeadLength = 3figureConnectedLineStartHeadWidth = 3% setting of end arrowfigureConnectedLineEndHeadStyle = 'ellipse' % shape of ending arrowfigureConnectedLineEndHeadLength = 7figureConnectedLineEndHeadWidth = 7end
2 案例
2.1 案例1:基础图形(设置1个局部放大区)
成图如下:

MATLAB代码如下:
clc
clear
close all
%%
addpath(genpath(pwd)) %  basic plotting
x = linspace(-0.1*pi,2*pi, 30);
y = cell(1, 3);
y{1, 1} = 0.4*sinc(x)+0.8;
y{1, 2} = tanh(x);
y{1, 3} = exp(-sinc(x));figure(1);
color_ = [0, 114, 189; 126, 47, 142; 162, 20, 47]/255;
ax = axes('Units', 'normalized');
hold(ax, 'on');
box(ax,'on');
set(ax, 'LineWidth', 1.2, 'TickDir', 'in');
for i = 1:3plot(x, y{1, i}, 'Parent', ax, 'Color', color_(i, :), 'LineWidth', 3)
end
set(gca,'Layer','top','FontSize',14,'Fontname', 'Times New Roman');% add a zoomed zone
zp = BaseZoom();
zp.plot;
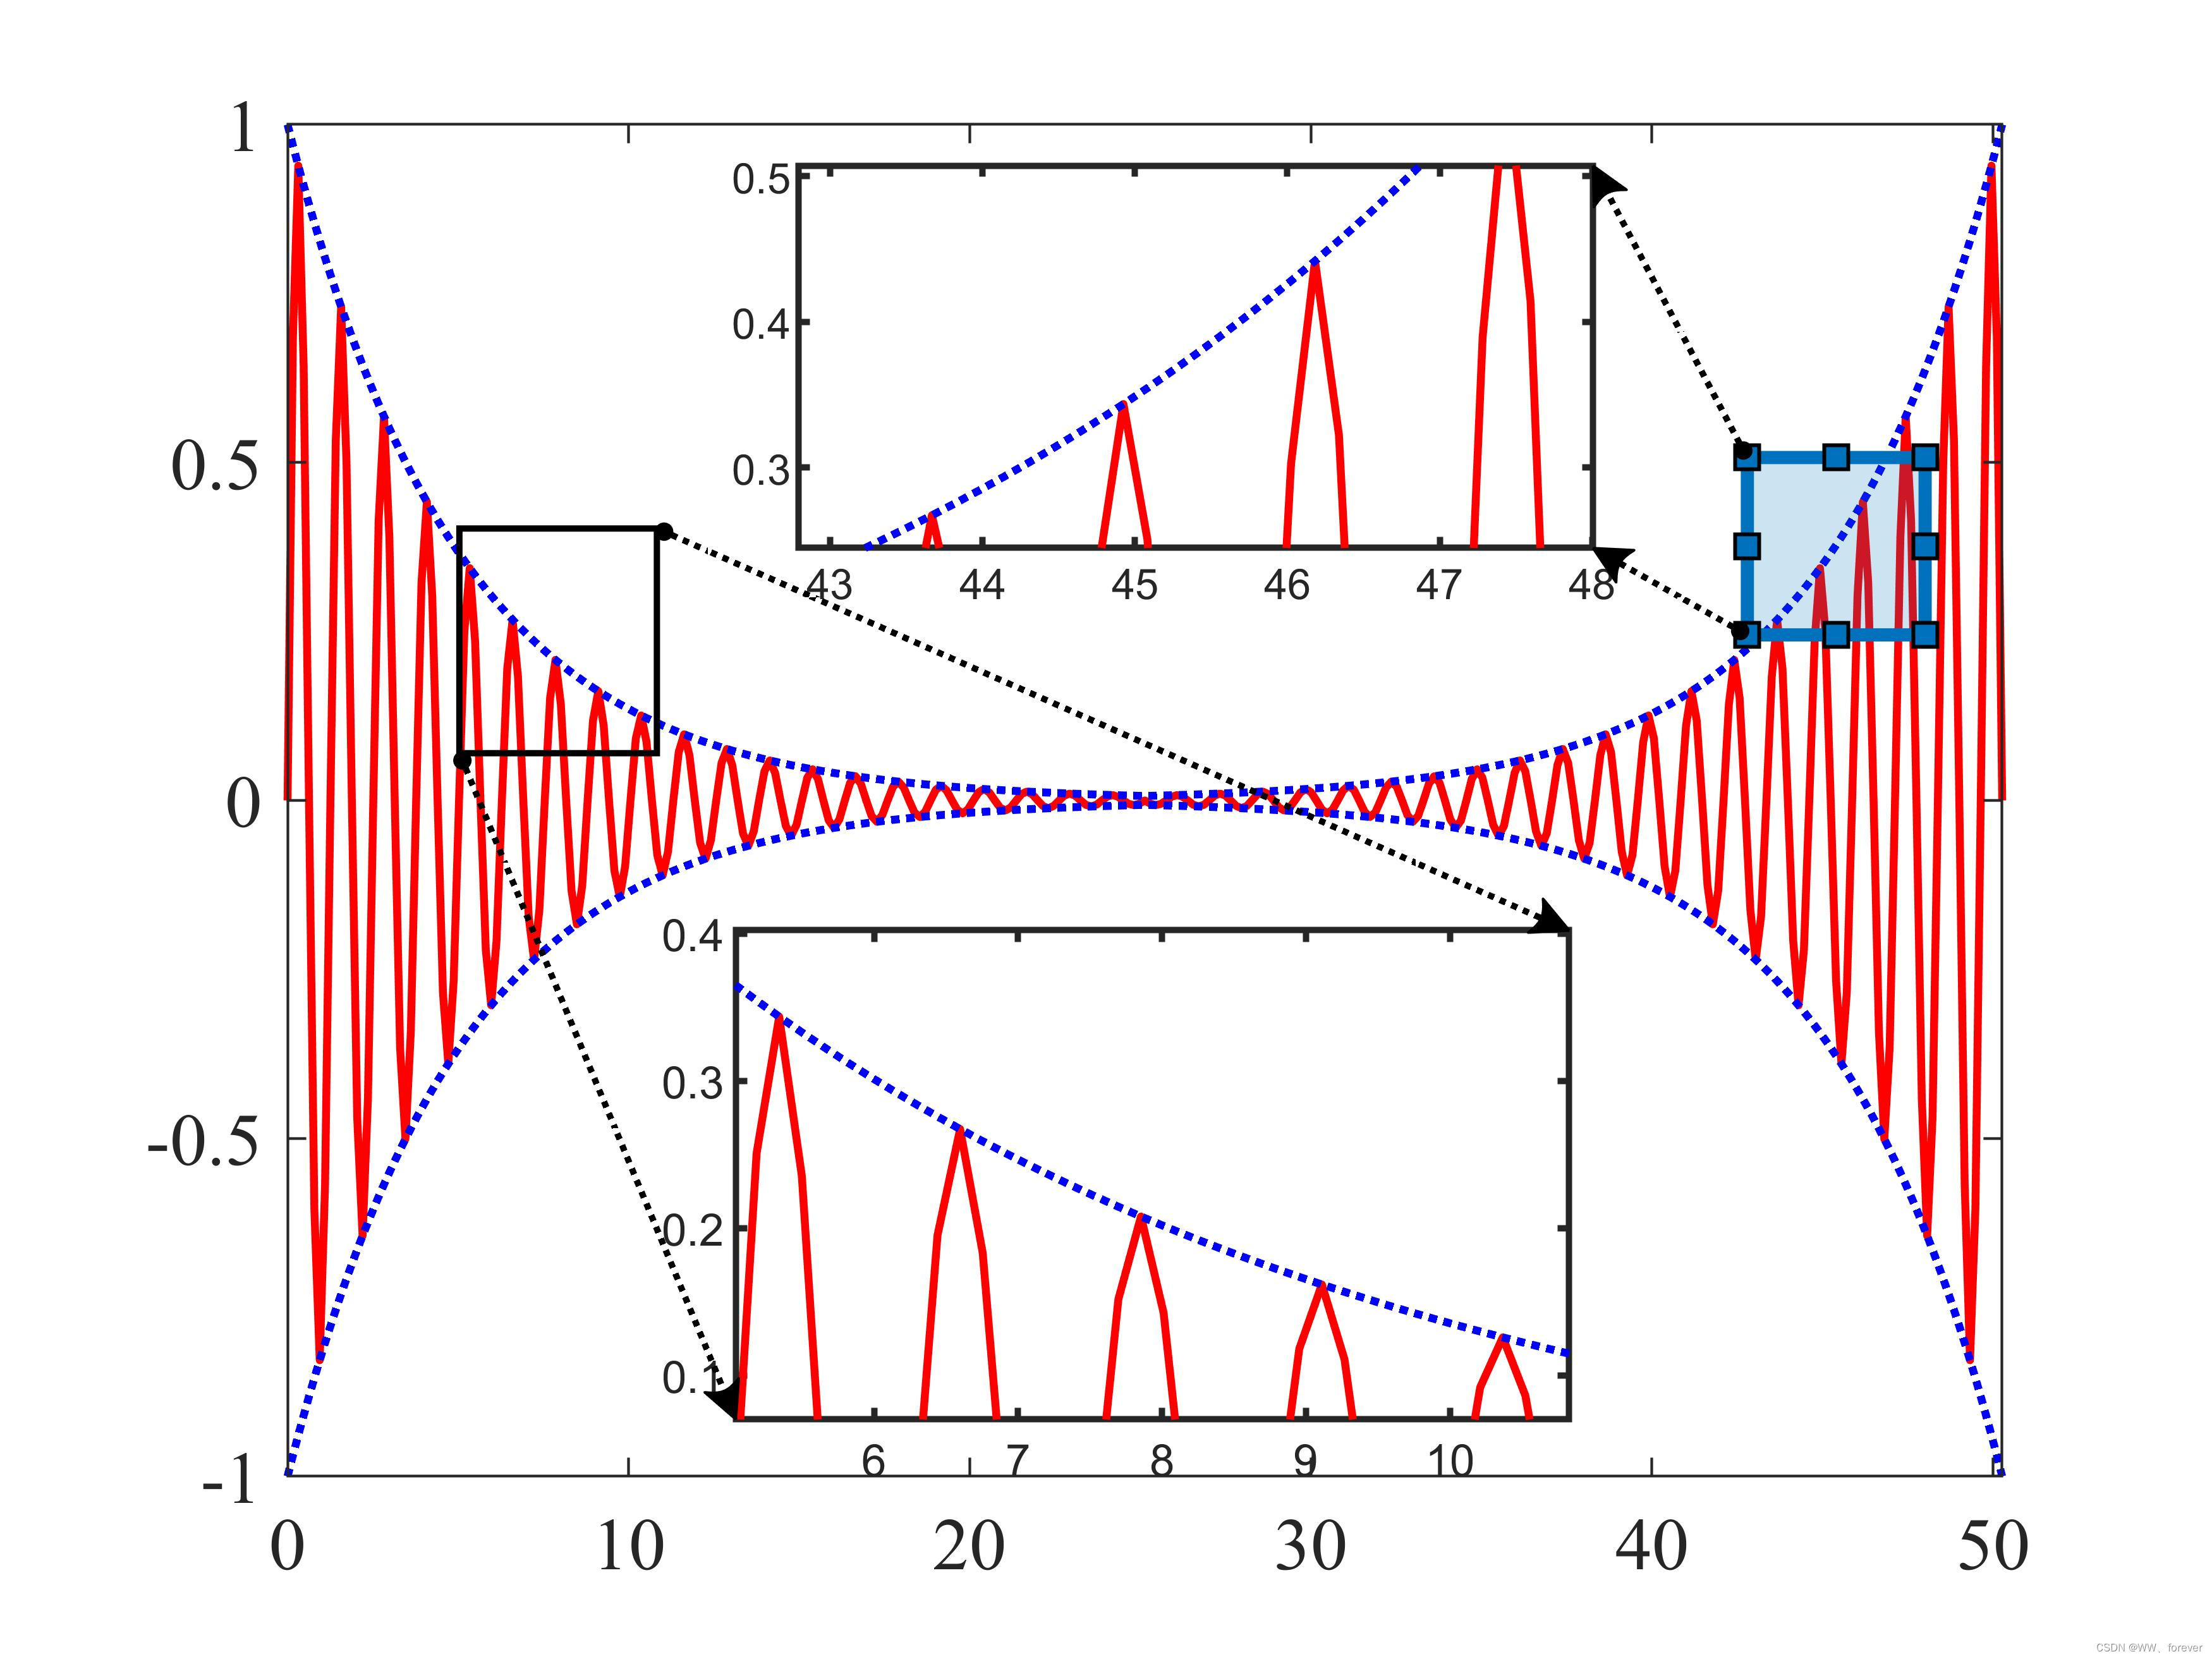
2.2 案例2:设置2个局部放大区
成图如下:
MATLAB代码如下:
clc
clear
close all
%%
addpath(genpath(pwd)) %  basic plotting
tmp_ = 5;
t1 = 0:pi/20:8*pi;
t2 = 8*pi:pi/20:16*pi;
y1_ = exp(-t1/tmp_ );
y2_ = exp(-t1/tmp_ ).*sin(tmp_ *t1);
t = [t1, t2];
y1 = [y1_, fliplr(y1_)];
y2 = [y2_, fliplr(y2_)];figure(1);
plot(t, y2, 'Color', 'r', 'LineStyle', '-', 'LineWidth', 1.5)
hold on
plot(t, y1, 'Color', 'b', 'LineStyle', ':', 'LineWidth', 1.5)
plot(t, -y1, 'Color', 'b', 'LineStyle', ':','LineWidth', 1.5)
xlim([min(t), max(t)])
set(gca,'Layer','top','FontSize',14,'Fontname', 'Times New Roman');% add 2 zoomed zones
zp = BaseZoom();
zp.plot;
zp.plot;