在vue2中用vue-echarts和v-charts绘制百度地图定制散点图

一、在vue-echarts中定制百度地图
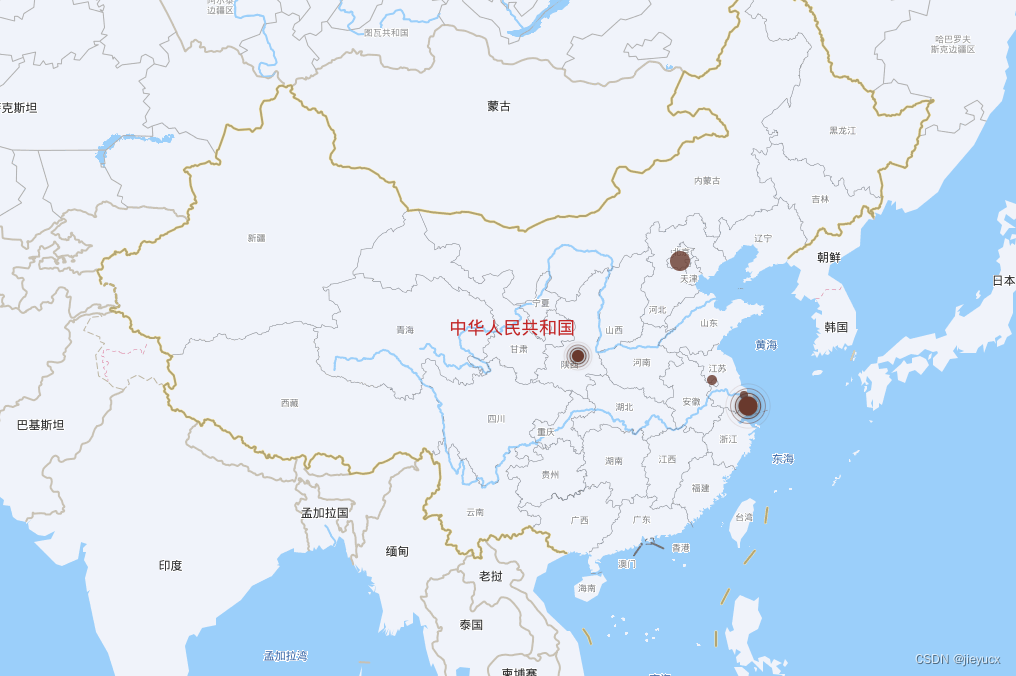
效果
准备
- 安装依赖
echartsvue-echarts
npm i echarts vue-echarts
- 在main.js中引入
import ECharts from “echarts”
import VueECharts from “vue-echarts”
Vue.prototype.$echarts = ECharts
Vue.component(“v-chart”, VueECharts)
- 在index.html中引入百度地图2.0 申请秘钥教程
<script
type=“text/javascript”
src=“https://api.map.baidu.com/api?v=2.0&ak=你的百度地图秘钥”
</script>
- 在你的页面中引入echarts/bmap
import ‘echarts/extension/bmap/bmap’ // 在echarts中使用百度地图
代码
<template><div class="tempBmap"><v-chart :options="options"></v-chart></div>
</template><script>
import 'echarts/extension/bmap/bmap' // 在echarts中使用百度地图const testPoint = [ // 绘制的点数据(实心){name: '海门',value: [121.15, 31.89, 80]},{name: '南京',value: [118.78, 32.84, 100]},{name: '北京',value: [116.405338, 39.91513, 200]}
]const testPoint2 = [ // 绘制的点数据(环形){name: '上海',value: [121.48054, 31.233212, 190]},{name: '西安',value: [108.94934, 34.341308, 120]}
]
export default {name: 'BMap',data() {return {options: {}}},mounted() {this.options = {title: {text: '界域的echarts报表统计',subtext: '趋势统计',sublink: 'https://gitee.com/chengxigitee/data-report',left: 'center'},bmap: {key: 'c7GwSbN0GSLjGZ46vpZQPUAKju1nlzpS',center: [104.114129, 37.550339],zoom: 5,roam: true // 地图是否可交互},tooltip: {},series: [ // 定制点{name: '销售额', // tip标题type: 'scatter',coordinateSystem: 'bmap', // 坐标系统 百度地图data: testPoint,encode: {value: 2 // 定制tip value},itemStyle: {color: '#0cb4d1', // 点的颜色},symbolSize: function(val) { // 设置点的大小// val: [108.94934, 34.341308, 120]return val[2] / 10},label: {show: false, // 显示valueposition: 'right',// formatter: '{b}', // 将显示的value改为标题formatter: function(val) {return `${val.data.name} - ${val.data.value[2]}`}},emphasis: {label: {show: true // 将label中的show置为false, 通过在这里的设置,让鼠标移上去再显示label内容}}},{name: 'top 2', // tip标题type: 'effectScatter',coordinateSystem: 'bmap', // 坐标系统 百度地图data: testPoint2,encode: {value: 2 // 定制tip value},itemStyle: {color: '#0cb4d1', // 点的颜色shadowBlur: 10,shadowColor: '#333'},symbolSize: function(val) { // 设置点的大小// val: [108.94934, 34.341308, 120]return val[2] / 10},label: {show: false, // 显示valueposition: 'right',// formatter: '{b}', // 将显示的value改为标题formatter: function(val) {return `${val.data.name} - ${val.data.value[2]}`}},emphasis: {label: {show: true // 将label中的show置为false, 通过在这里的设置,让鼠标移上去再显示label内容}},hoverAnimation: true, // 鼠标移动到点上rippleEffect: {brushType: 'stroke' // 波纹样式 空心}}]}}
}
</script><style lang="scss" scoped>
.tempBmap {width: 100%;height: 1000px;
}
</style>
二、在v-charts中绘制百度地图
准备
- 安装依赖
echarts v-charts
npm i echarts v-charts
- 在main.js中引入
import VCharts from ‘v-charts’
import ‘v-charts/lib/style.css’
Vue.use(VCharts)
代码
<template><div class="tempBmap2"><ve-bmap height="100%" :settings="chartSettings" :title="title" :tooltip="{}" :series="chartSeries"></ve-bmap></div>
</template><script>const testPoint = [ // 绘制的点数据(实心){name: '海门',value: [121.15, 31.89, 80]},{name: '南京',value: [118.78, 32.84, 100]},{name: '北京',value: [116.405338, 39.91513, 200]}
]const testPoint2 = [ // 绘制的点数据(环形){name: '上海',value: [121.48054, 31.233212, 190]},{name: '西安',value: [108.94934, 34.341308, 120]}
]
export default {name: 'BMap2',data() {return {title: {text: '界域的echarts报表统计',subtext: '趋势统计',sublink: 'https://gitee.com/chengxigitee/data-report',left: 'center'},chartSettings: {key: 'c7GwSbN0GSLjGZ46vpZQPUAKju1nlzpS',bmap: {center: [104.114129, 37.550339],zoom: 5,roam: true,mapStyle: {}}},chartSeries: [{name: '销售额', // tip标题type: 'scatter',coordinateSystem: 'bmap', // 坐标系统 百度地图data: testPoint,encode: {value: 2 // 定制tip value},itemStyle: {color: '#69392d', // 点的颜色},symbolSize: function (val) { // 设置点的大小// val: [108.94934, 34.341308, 120]return val[2] / 10},label: {show: false, // 显示valueposition: 'right',// formatter: '{b}', // 将显示的value改为标题formatter: function (val) {return `${val.data.name} - ${val.data.value[2]}`}},emphasis: {label: {show: true // 将label中的show置为false, 通过在这里的设置,让鼠标移上去再显示label内容}}},{name: 'top 2', // tip标题type: 'effectScatter',coordinateSystem: 'bmap', // 坐标系统 百度地图data: testPoint2,encode: {value: 2 // 定制tip value},itemStyle: {color: '#69392d', // 点的颜色shadowBlur: 10,shadowColor: '#333'},symbolSize: function (val) { // 设置点的大小// val: [108.94934, 34.341308, 120]return val[2] / 10},label: {show: false, // 显示valueposition: 'right',// formatter: '{b}', // 将显示的value改为标题formatter: function (val) {return `${val.data.name} - ${val.data.value[2]}`}},emphasis: {label: {show: true // 将label中的show置为false, 通过在这里的设置,让鼠标移上去再显示label内容}},hoverAnimation: true, // 鼠标移动到点上rippleEffect: {brushType: 'stroke' // 波纹样式 空心}}]}}
}
</script><style lang="scss" scoped>
.tempBmap2 {width: 100%;height: 1000px;
}
</style>