Kubernetes 多集群网络方案系列 2 -- Submariner 监控

Submariner 是一个用于连接 Kubernetes 集群的跨集群网络解决方案,可以实现集群之间的服务发现、网络通信等功能。
Prometheus 是一个开源的监控和告警系统,专门用于收集、存储和查询各种应用、系统和基础设施的实时指标数据。Prometheus 具备多维数据模型、灵活的查询语言(PromQL)、高效的存储等特点,广泛应用于 Kubernetes 集群监控、服务可用性监控、性能分析等场景。
Grafana 是一款流行的开源数据可视化工具,可以与 Prometheus 等各种数据源集成,为用户提供丰富、实用的监控图表和仪表盘。
在本文中,将介绍如何利用 Prometheus 对 Submariner 进行监控,并通过 Grafana 展示监控数据的图表。我们可以通过监控了解 Submariner 多集群的连接状态,连接延时等指标,并及时发现潜在的问题。
本文是 Kubernetes 多集群网络方案系列的第 2 篇文章:
- Kubernetes 多集群网络方案系列 1 – Submariner 介绍
- Kubernetes 多集群网络方案系列 2 – Submariner 监控(本文)
1 前提条件
在开始本实验前,请确保你已经安装了以下工具:
- Kubectl:Kubernetes 的命令行工具,用于与 Kubernetes 集群进行交互和管理集群资源。
- Subctl:Submariner 的命令行工具,用于简化 Submariner 的部署和管理过程。通过 subctl,可以快速部署 Submariner 到 Kubernetes 集群,以及查看集群和连接的状态。
- Kind:Kubernetes in Docker(Kind)是一个用于在本地运行 Kubernetes 集群的工具,特别适合开发和测试环境。
- Helm:Helm 是 Kubernetes 的包管理工具,用于简化 Kubernetes 应用的部署、升级和管理。
2 克隆代码
本实验相关的代码保存在 Github 上,执行以下命令获取。
git clone https://github.com/cr7258/hands-on-lab.git
cd hands-on-lab/multi-cluster/submariner/monitoring/
3 创建集群
首先执行以下命令,在本地使用 Kind 创建两个 Kubernetes 集群。这两个集群中,cluster-1 将充当 Broker 集群的角色,而所有需要相互通信的集群都将注册到 Broker 集群上。同时 cluster-1 自身也作为连接集群注册到 Broker 集群。
# 替换成服务器 IP
export SERVER_IP="10.138.0.11"kind create cluster --config - <<EOF
kind: Cluster
name: cluster-1
apiVersion: kind.x-k8s.io/v1alpha4
nodes:
- role: control-plane
- role: worker
networking:apiServerAddress: $SERVER_IPpodSubnet: "10.8.0.0/16"serviceSubnet: "10.88.0.0/16"
EOFkind create cluster --config - <<EOF
kind: Cluster
name: cluster-2
apiVersion: kind.x-k8s.io/v1alpha4
nodes:
- role: control-plane
- role: worker
networking:apiServerAddress: $SERVER_IPpodSubnet: "10.9.0.0/16"serviceSubnet: "10.99.0.0/16"
EOF
4 部署 Submariner
执行以下命令,在 cluster-1 集群上部署 Broker。部署完成后,会生成 broker-info.subm 文件,文件以 Base64 加密,其中包含了连接 Broker 集群 API Server 的地址以及证书信息,还有 IPsec 的密钥信息。
subctl --context kind-cluster-1 deploy-broker
在将集群注册到 Broker 之前,我们需要做两件事:
- 1.(可选)分别在 cluster-1 和 cluster-2 集群中各选择一个点打上
submariner.io/gateway=trueLabel,Submariner 会将这些节点作为 Gateway 节点,用于建立跨集群通信的隧道。如果没有节点含有这个 Label,在执行subctl join加入集群时也会提示我们选择一个节点作为 Gateway 节点。 - 2.在 cluster-1 和 cluster-2 集群的 Gateway 节点加上
gateway.submariner.io/public-ip=ipv4:<节点 IP>Annotation,用于设置 Gateway 节点的 Public IP。这里先解释一下 Submariner 中的 Private IP 和 Public IP:Private IP 是 Gateway 节点服务器的接口 IP,Public IP 是 Gateway 节点的公网 IP,Submariner 默认通过请求 ipify.org, my-ip.io, seeip.org 这几个网站来获取节点的 Public IP。由于我们的 Submariner 多集群是通过内网 IP 互相建立连接的,因此不需要通过公网暴露 Gateway 节点。但是 Submariner 目前只会将 Public IP 作为 Prometheus 指标中展示的端点地址,而不会考虑集群间究竟是通过公网 IP 还是内网 IP 建立连接的。因此,我们选择手动将 Public IP 标记为 Gateway 节点的 IP。
# 获取 cluster-1-worker 节点的 IP 地址
export CLUSTER_1_WORKER_IP=$(docker inspect --format '{{ .NetworkSettings.Networks.kind.IPAddress }}' cluster-1-worker)
# 设置 Gateway 节点 Public IP
kubectl --context kind-cluster-1 annotate node cluster-1-worker gateway.submariner.io/public-ip=ipv4:$CLUSTER_1_WORKER_IP --overwrite
# 标记 cluster-1-worker 为 Gateway 节点
kubectl --context kind-cluster-1 label node cluster-1-worker submariner.io/gateway=true --overwrite# 获取 cluster-2-worker 节点的 IP 地址
export CLUSTER_2_WORKER_IP=$(docker inspect --format '{{ .NetworkSettings.Networks.kind.IPAddress }}' cluster-2-worker)
# 设置 Gateway 节点 Public IP
kubectl --context kind-cluster-2 annotate node cluster-2-worker gateway.submariner.io/public-ip=ipv4:$CLUSTER_2_WORKER_IP --overwrite
# 标记 cluster-2-worker 为 Gateway 节点
kubectl --context kind-cluster-2 label node cluster-2-worker submariner.io/gateway=true --overwrite
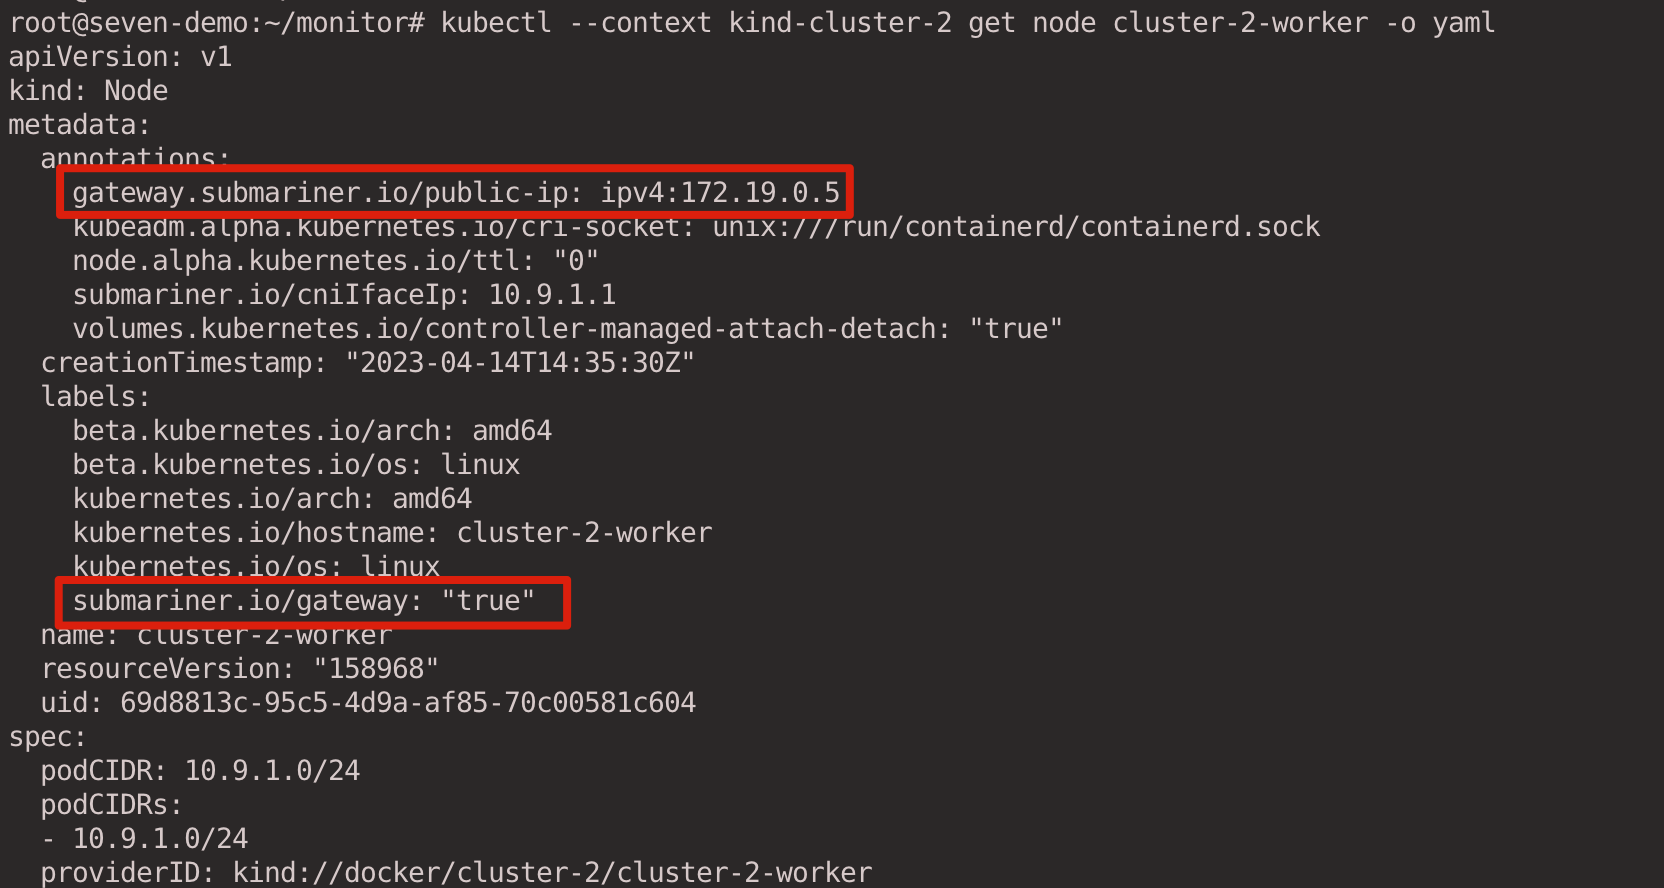
分别确认 cluster-1-worker 和 cluster-2-worker 节点已经添加了 gateway.submariner.io/public-ip=ipv4:<节点 IP> Annotation,并且设置了 submariner.io/gateway=true Label。
kubectl --context kind-cluster-1 get node cluster-1-worker -o yaml

kubectl --context kind-cluster-2 get node cluster-2-worker -o yaml
执行 subctl join 命令将 cluster-1 和 cluster-2 两个集群加入 Broker 集群。
- 使用
--clusterid参数指定集群 ID,每个集群 ID 需要唯一。 - 提供上一步生成的
broker-info.subm文件用于集群注册。 --air-gapped参数表示集群是在内网环境进行连接的,Submariner 不会尝试通过节点公网 IP 进行连接。
subctl --context kind-cluster-1 join broker-info.subm --clusterid cluster-1 --air-gapped
subctl --context kind-cluster-2 join broker-info.subm --clusterid cluster-2 --air-gapped
5 部署 Prometheus
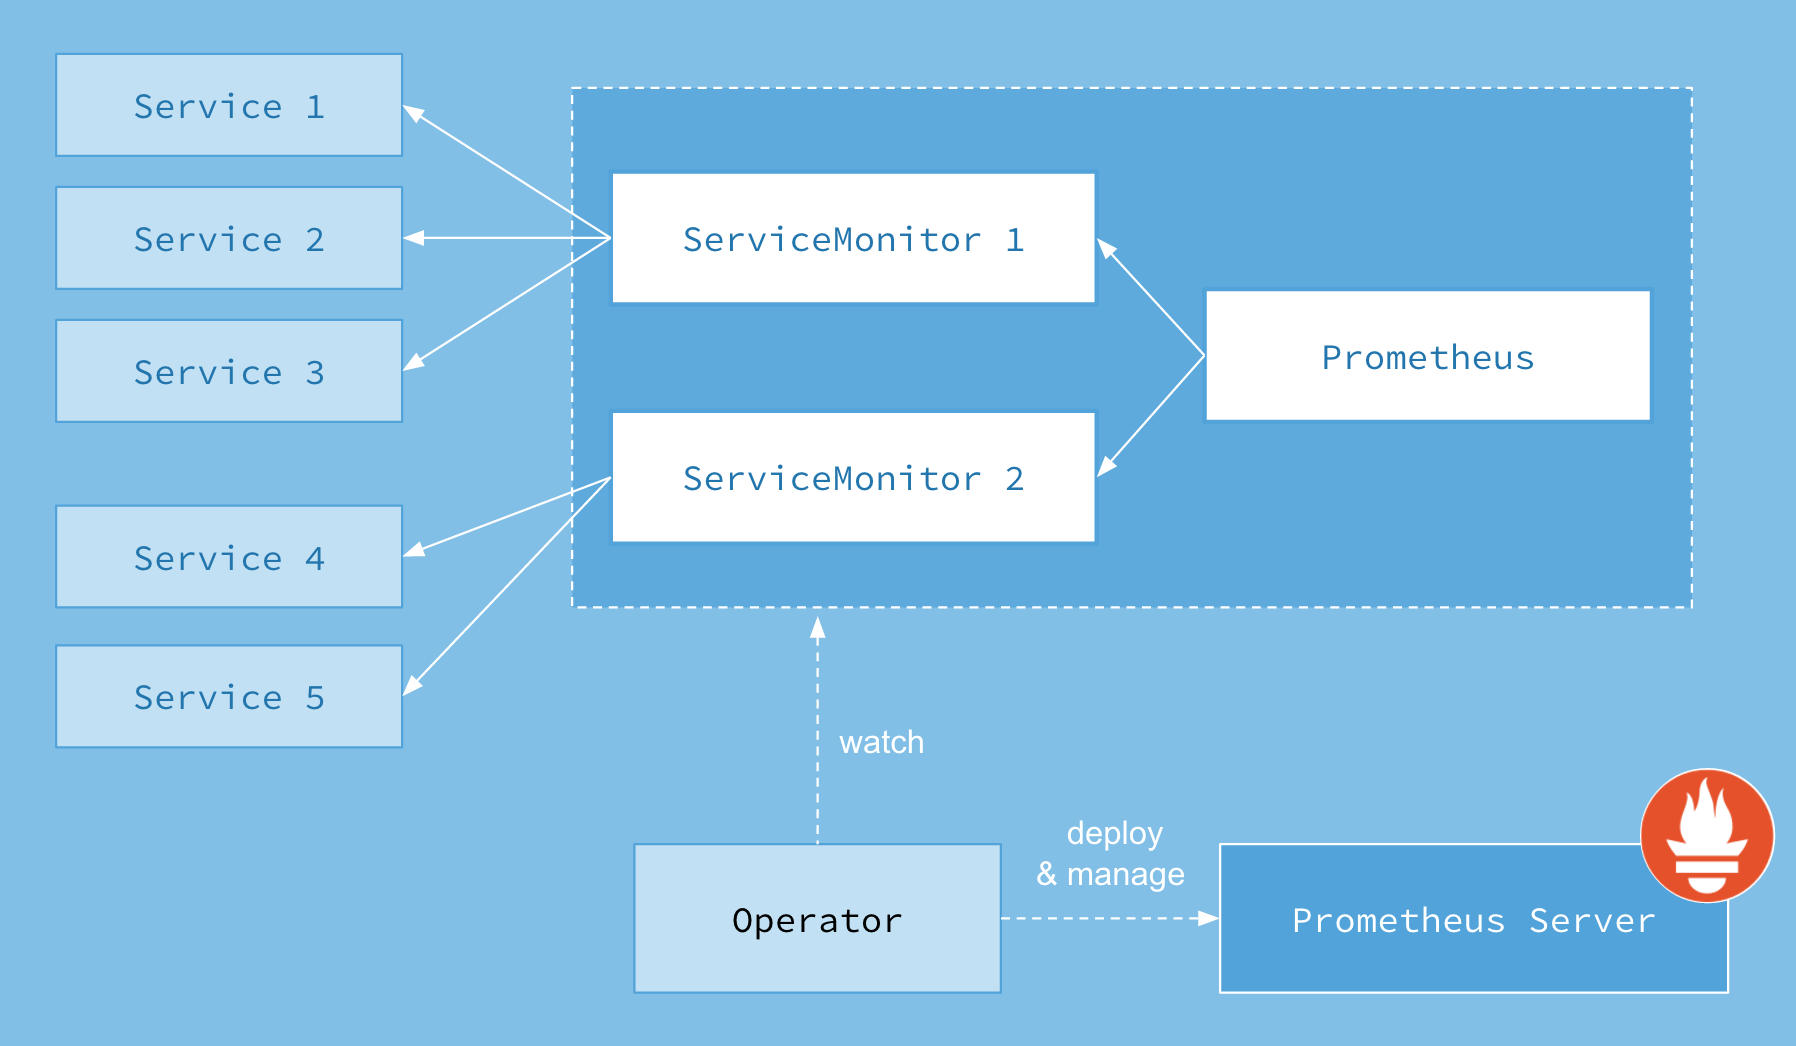
Prometheus Operator 是一个用于在 Kubernetes 集群上部署和管理 Prometheus 的开源项目。它使用 Kubernetes 的自定义资源定义 (CRDs) 来管理 Prometheus, ServiceMonitors 和 PodMonitors 等对象。
在本实验中,我们将使用 Prometheus Operator 来管理 Prometheus。执行以下命令使用 Helm 在 cluster-1 集群安装 Prometheus Operator。
wget https://github.com/prometheus-operator/prometheus-operator/releases/download/v0.64.0/bundle.yaml
kubectl --context kind-cluster-1 create -f bundle.yaml
在开始部署 Prometheus 之前,需要先为 Prometheus 创建所需的 ServiceAccount 和 ClusterRole/ClusterRoleBinding。这些资源将确保 Prometheus 有足够的权限来访问 Kubernetes API。
# rbac.yaml
apiVersion: v1
kind: ServiceAccount
metadata:name: prometheus
---
apiVersion: rbac.authorization.k8s.io/v1
kind: ClusterRole
metadata:name: prometheus
rules:
- apiGroups: [""]resources:- nodes- nodes/metrics- services- endpoints- podsverbs: ["get", "list", "watch"]
- apiGroups: [""]resources:- configmapsverbs: ["get"]
- apiGroups:- networking.k8s.ioresources:- ingressesverbs: ["get", "list", "watch"]
- nonResourceURLs: ["/metrics"]verbs: ["get"]
---
apiVersion: rbac.authorization.k8s.io/v1
kind: ClusterRoleBinding
metadata:name: prometheus
roleRef:apiGroup: rbac.authorization.k8s.iokind: ClusterRolename: prometheus
subjects:
- kind: ServiceAccountname: prometheusnamespace: default
执行以下命令,在 cluster-1 集群创建 Prometheus 所需的 RBAC 资源。
kubectl --context kind-cluster-1 apply -f rbac.yaml
接下来在 cluster-1 集群上部署 Prometheus。每个 Prometheus CRD 资源会被 Prometheus Operator 部署为一个 StatefulSet,位于相同的命名空间下,并根据配置生成对应的资源。serviceMonitorNamespaceSelector: {} 表示允许选择所有 Namespace 的 ServiceMonitor。serviceMonitorSelector 则根据 Label 选择 Prometheus 实例应该包含哪些 ServiceMonitors。ServiceMonitors 将在稍后进行配置,其中具体定义了监控 Service 的规则,并添加 monitor: "true" Label。
# prometheus.yaml
apiVersion: monitoring.coreos.com/v1
kind: Prometheus
metadata:name: prometheuslabels:prometheus: prometheus
spec:replicas: 1serviceAccountName: prometheusserviceMonitorNamespaceSelector: {}serviceMonitorSelector:matchLabels:monitor: "true"
执行以下命令,在 cluster-1 集群部署和配置 Prometheus。
kubectl --context kind-cluster-1 apply -f prometheus.yaml
6 创建 ServiceMonitor
虽然 Submariner 会自动为 Gateway Engine, Lighthouse DNS 等组件创建 ServiceMointor,但是在本实验中并不能完全满足我们的需求,因此这里选择另外创建 ServiceMonitor。
在 ServiceMonitor 中定义 Prometheus 监控规则:
- 使用
selector来根据 Label 来选择要监控 Service。 - 为每个 ServiceMonitor 添加 relabelings 配置,为 cluster-1 集群的 Prometheus 指标加上
cluster: cluster-1Label。在后面我们会在 cluster-1 集群中通过 Prometheus Federation 来采集 cluster-2 集群的指标进行统一的展现,因此这里打上 cluster Label 来区分不同的集群。 - 为每个 ServiceMonitor 添加
monitor: "true"Label 匹配上面在 Prometheus CRD 设置的serviceMonitorSelector的配置。
# servicemonitor-cluster-1.yaml
apiVersion: monitoring.coreos.com/v1
kind: ServiceMonitor
metadata:name: submariner-gateway-servicemonitornamespace: submariner-operatorlabels:app: submariner-gatewaymonitor: "true"
spec:selector:matchLabels:app: submariner-metrics-proxyendpoints:- port: metricsrelabelings:- targetLabel: clusterreplacement: cluster-1
---
apiVersion: monitoring.coreos.com/v1
kind: ServiceMonitor
metadata:name: submariner-lighthouse-agent-servicemonitornamespace: submariner-operatorlabels:app: submariner-lighthouse-agentmonitor: "true"
spec:selector:matchLabels:app: submariner-lighthouse-agentendpoints:- port: metricsrelabelings:- targetLabel: clusterreplacement: cluster-1
---
apiVersion: monitoring.coreos.com/v1
kind: ServiceMonitor
metadata:name: submariner-lighthouse-coredns-servicemonitornamespace: submariner-operatorlabels:app: submariner-lighthouse-corednsmonitor: "true"
spec:selector:matchLabels:app: submariner-lighthouse-corednsendpoints:- port: metricsrelabelings:- targetLabel: clusterreplacement: cluster-1
---
apiVersion: monitoring.coreos.com/v1
kind: ServiceMonitor
metadata:name: submariner-operator-servicemonitornamespace: submariner-operatorlabels:name: submariner-operatormonitor: "true"
spec:selector:matchLabels:name: submariner-operatorendpoints:- port: metricsrelabelings:- targetLabel: clusterreplacement: cluster-1
执行以下命令,在 cluster-1 集群创建 Submariner 服务相关的 ServiceMonitor 资源。
kubectl --context kind-cluster-1 apply -f servicemonitor-cluster-1.yaml
通过 kubectl port-forward 命令将 Prometheus Service 转发到本机 9090 端口提供访问。
kubectl port-forward --context kind-cluster-1 --address 0.0.0.0 svc/prometheus-operated 9090:9090
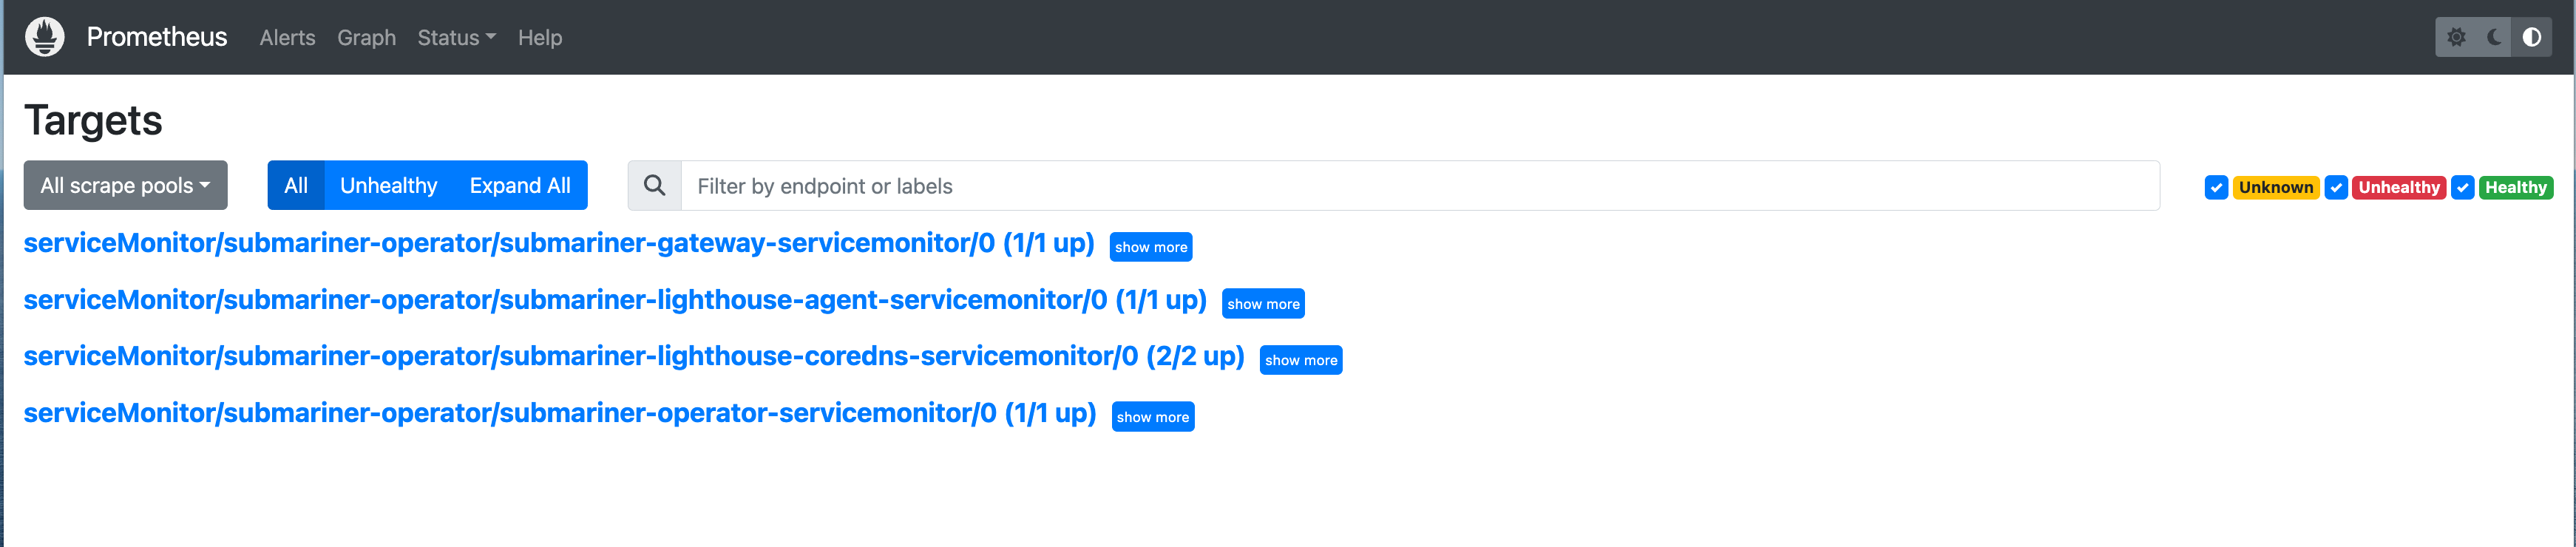
浏览器输入 http://<服务器 IP>:9090 访问 Prometheus Web 界面。可以看到 Prometheus 已经自动发现了 Submariner 相关的组件。
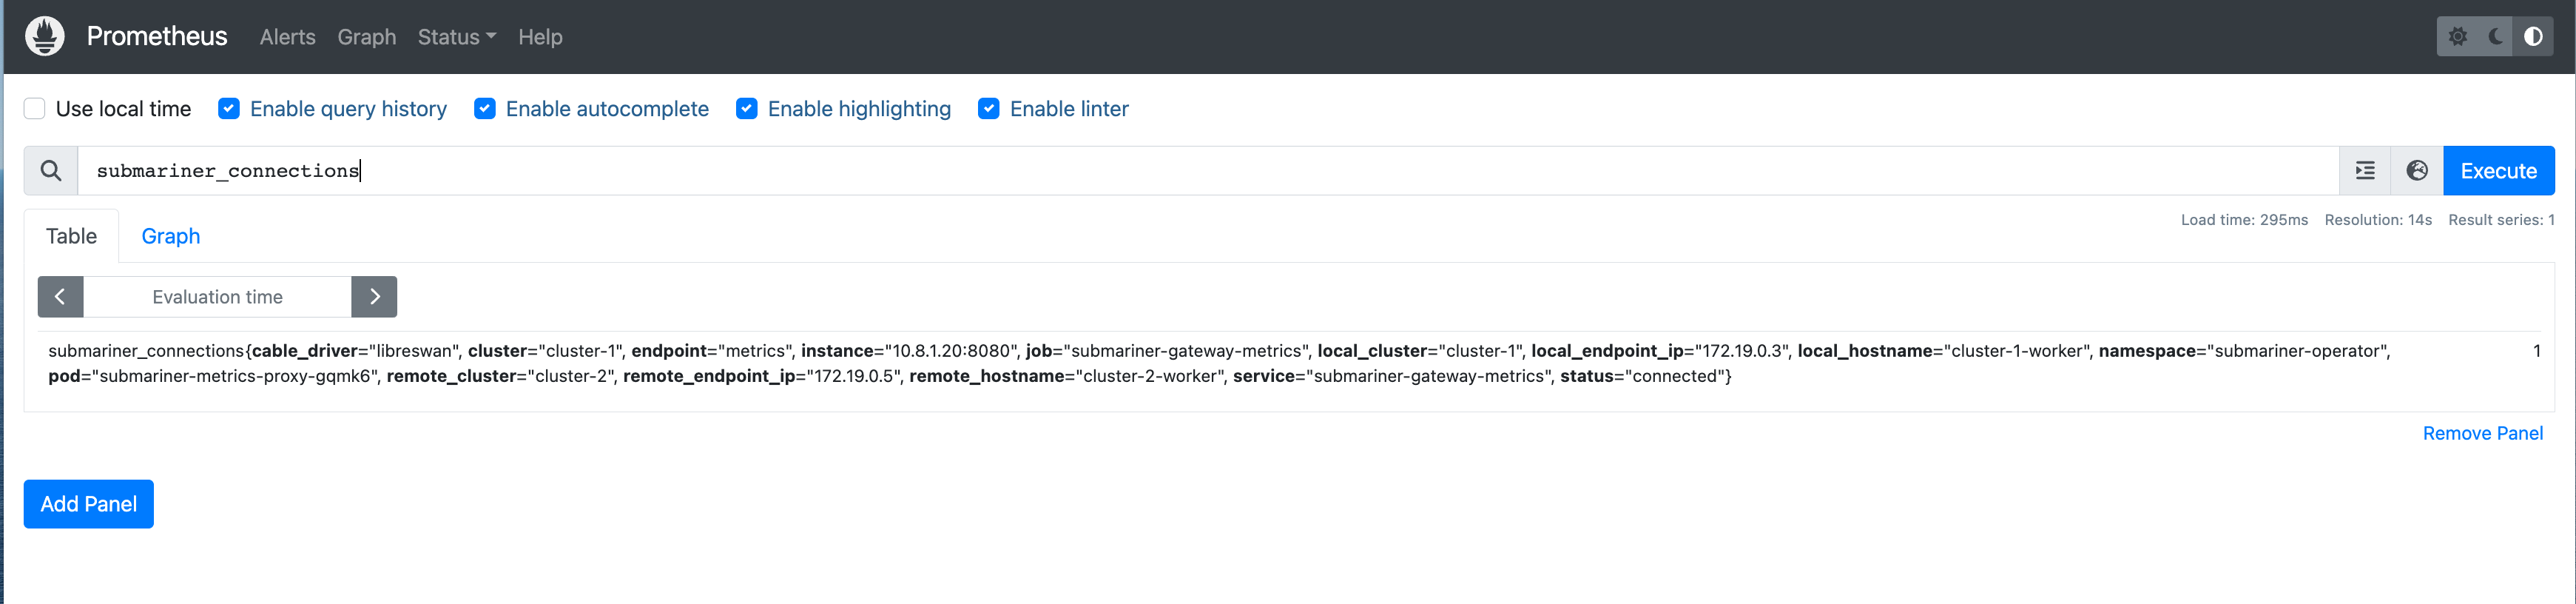
尝试查询一条指标,当前在 Prometheus 中只有 cluster-1 集群的数据。
7 Prometheus Federation 设置
Prometheus Federation 允许用户将多个 Prometheus 实例的指标汇总到主 Prometheus Server 上(本实验中是 cluster-1 的 Prometheus)进行分析和查询。在 Submariner 的多集群环境中,建立 Prometheus Federation 变得更加容易,我们可以轻松地导出集群中的 Prometheus 服务,并将其配置为主 Prometheus 的抓取目标。
接下来,我们将在 cluster-2 集群中部署 Prometheus,以收集该集群的 Submariner 指标。然后,通过 Prometheus Federation 在 cluster-1 集群中收集 cluster-2 集群的指标,并将其统一展示。
7.1 Cluster2 部署 Prometheus 并设置 ServiceMonitor
执行以下命令,在 cluster-2 集群部署 Prometheus。
kubectl --context kind-cluster-2 create -f bundle.yaml
kubectl --context kind-cluster-2 create -f rbac.yaml
kubectl --context kind-cluster-2 create -f prometheus.yaml
执行以下命令,在 cluster-2 集群创建 Submariner 服务相关的 ServiceMonitor 资源。和 cluster-1 集群的 ServiceMonitor 有所不同,cluster-2 集群的 ServiceMonitor 没有为指标添加 cluster: cluster-1 Label,因为我们后面可以在 cluster-1 的 Prometheus Federation job 中统一为从其他集群抓取的指标添加 cluster Label 来标识集群信息。
kubectl --context kind-cluster-2 apply -f servicemonitor.yaml
使用 Submariner 将 cluster-2 集群的 Prometheus 服务发布出来,使得 cluster-1 集群能够访问该服务。
subctl --context kind-cluster-2 export service prometheus-operated --namespace default
7.2 Cluster1 设置 Federation
为了实现 Prometheus Federation,我们需要向主 Prometheus Server (cluster-1 的 Prometheus)添加额外的抓取配置。
- targets 中设置 cluster-2 集群 Prometheus 的地址。跨集群场景下,Submariner 通过
<pod-name>.<cluster-id>.<svc-name>.<ns>.svc.clusterset.local的格式来解析 Headless Service + StatefulSet 的域名。 - 为来着 cluster-2 集群的指标添加
cluster: 'cluster-2'Label。
# additional-scrape-configs.yaml
- job_name: 'prometheus-federate'honor_labels: truemetrics_path: '/federate'params:'match[]':- '{__name__=~"submariner.*"}'static_configs:- targets:- 'prometheus-prometheus-0.cluster-2.prometheus-operated.default.svc.clusterset.local:9090'labels:cluster: 'cluster-2'metric_relabel_configs:- regex: 'prometheus.*'action: labeldrop
根据以上配置文件创建 Secert 清单文件,并应用到 cluster-1 集群中。
kubectl --context kind-cluster-1 create secret generic additional-scrape-configs --from-file=prometheus-additional.yaml --dry-run=client -oyaml > additional-scrape-configs.yaml
kubectl --context kind-cluster-1 apply -f additional-scrape-configs.yaml
修改 cluster-1 的 Prometheus CRD,additionalScrapeConfigs 引用附加的抓取配置。
# prometheus-federate.yaml
apiVersion: monitoring.coreos.com/v1
kind: Prometheus
metadata:name: prometheuslabels:prometheus: prometheus
spec:replicas: 1serviceAccountName: prometheusserviceMonitorNamespaceSelector: {}serviceMonitorSelector:matchLabels:monitor: "true"additionalScrapeConfigs:name: additional-scrape-configskey: prometheus-additional.yaml
执行以下命令,在 cluster-1 集群中更新 Prometheus 配置。
kubectl --context kind-cluster-1 apply -f prometheus-federate.yaml
等待 Prometheus 重新加载配置后,可以在 Prometheus 界面中看到新增了 Federation 的抓取配置。
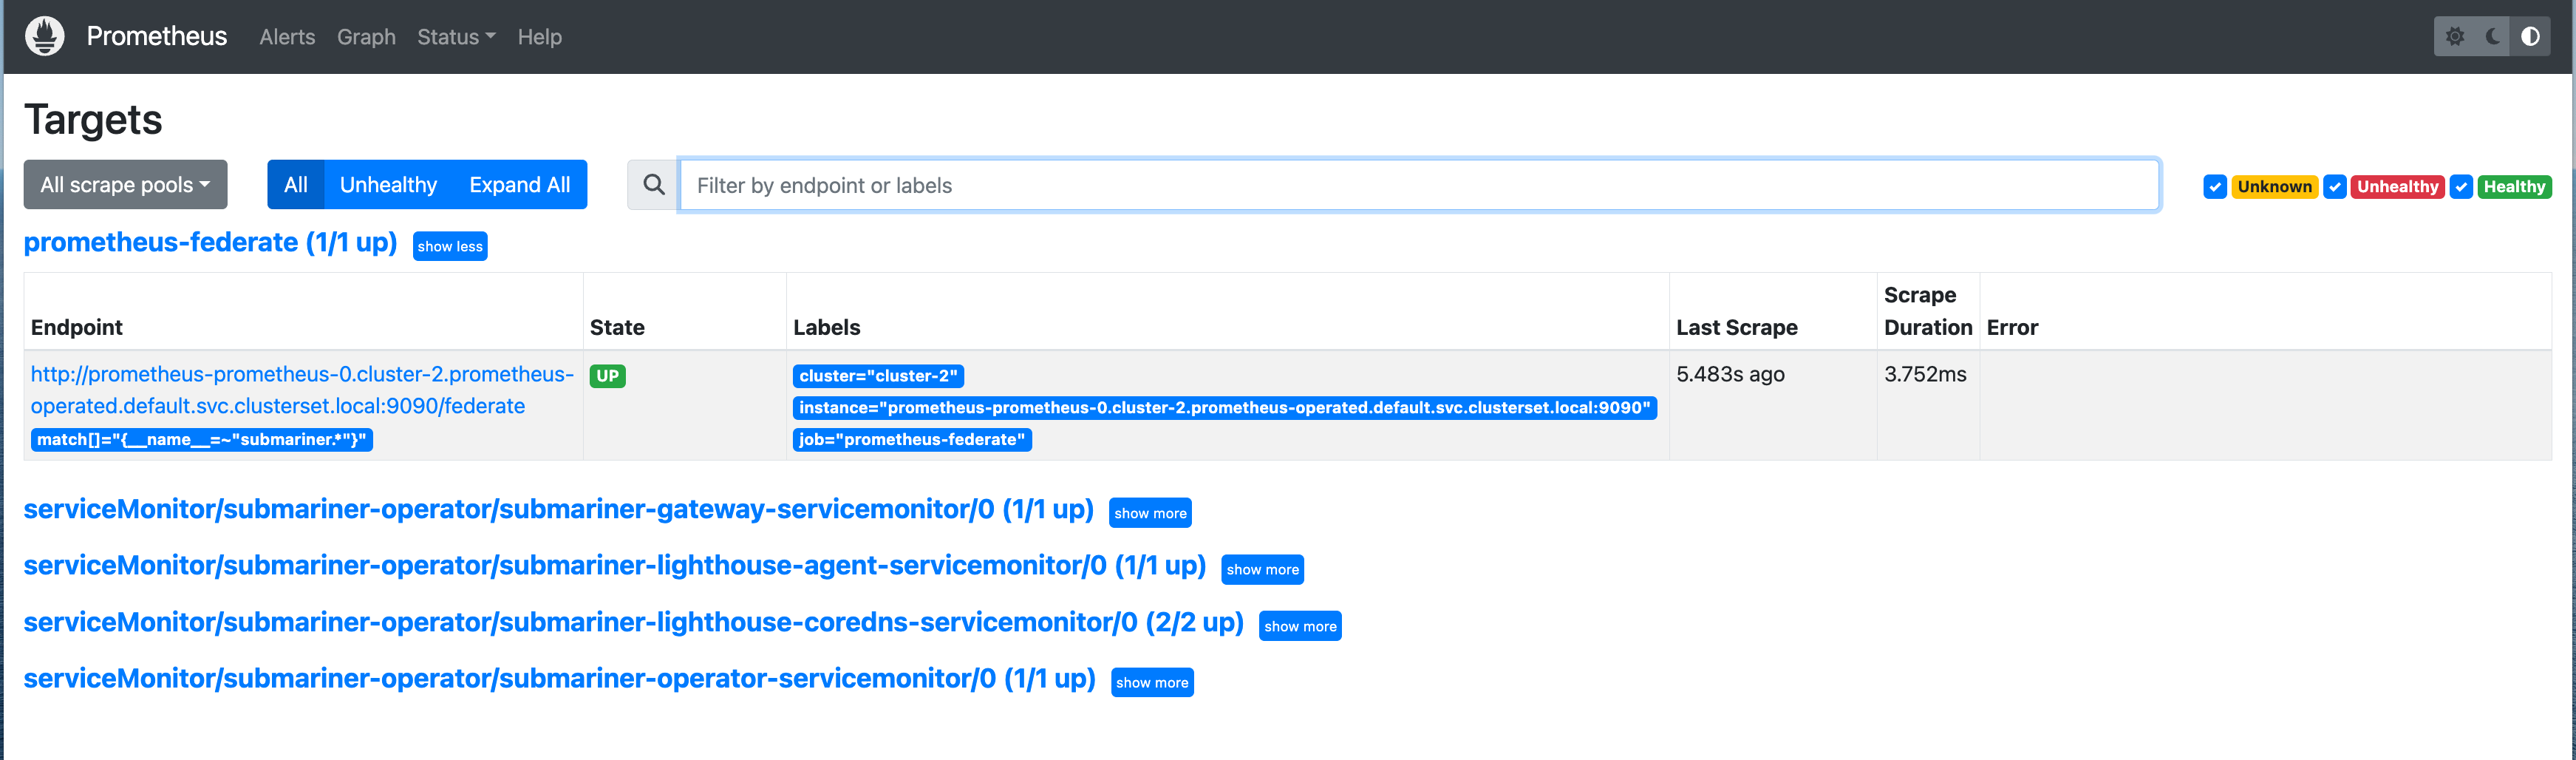
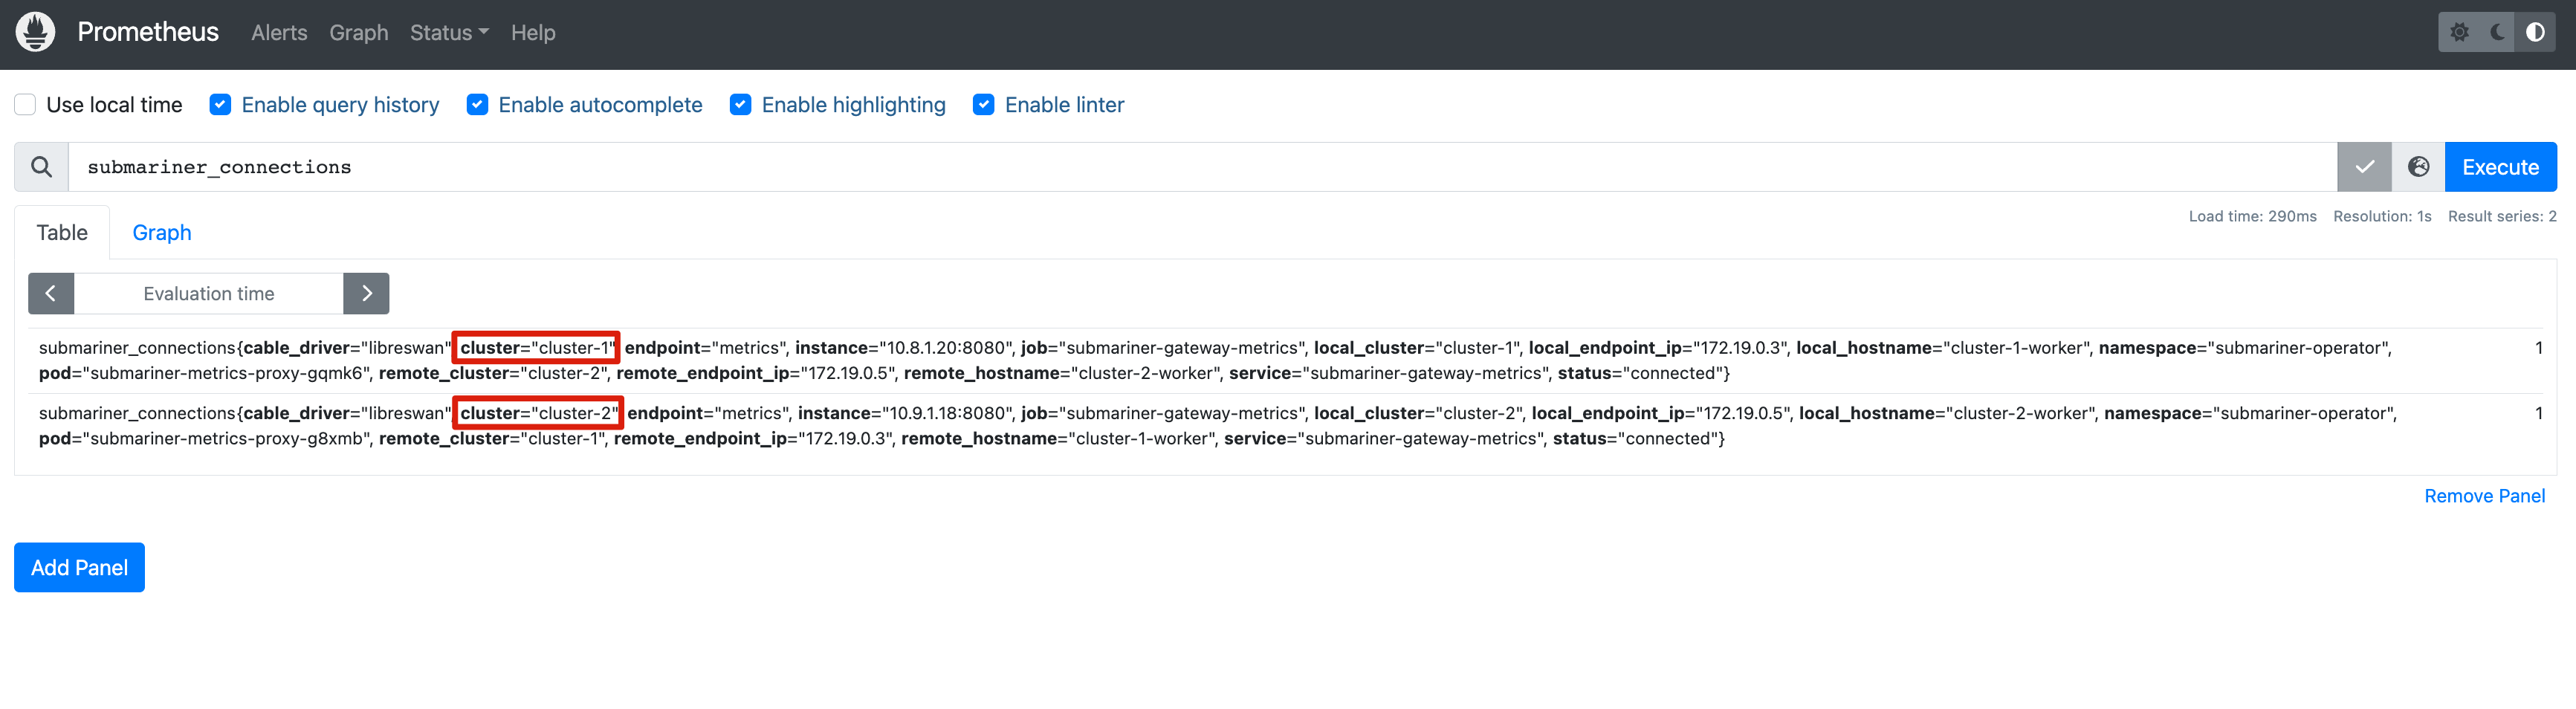
此时 cluster-1 集群的 Prometheus 包含了来自两个集群的指标。
8 部署 Grafana
和 Prometheus Operator 类似,Grafana 同样也提供了 Operator 来简化 Grafana 的安装,以及仪表盘和数据源的管理。执行以下命令使用 Helm 在 cluster-1 集群安装 Grafana Operator。
helm --kube-context kind-cluster-1 upgrade -i grafana-operator oci://ghcr.io/grafana-operator/helm-charts/grafana-operator --version v5.0.0-rc0
使用 Grafana CRD 可以方便地在 Kubernetes 中安装 Grafana,这里设置 Grafana 的用户名为 root,密码为 root123。在 GrafanaDatasource CRD 中,将集群中的 Prometheus 作为数据源,以便 Grafana 连接并显示 Prometheus 的监控数据。
# grafana.yaml
apiVersion: grafana.integreatly.org/v1beta1
kind: Grafana
metadata:name: grafanalabels:dashboards: "grafana"
spec:config:log:mode: "console"auth:disable_login_form: "false"security:admin_user: rootadmin_password: root123
---
apiVersion: grafana.integreatly.org/v1beta1
kind: GrafanaDatasource
metadata:name: grafanadatasource
spec:datasource:access: proxytype: prometheusjsonData:timeInterval: 5stlsSkipVerify: truename: Prometheusurl: http://prometheus-operated:9090isDefault: trueinstanceSelector:matchLabels:dashboards: "grafana"
执行以下命令,在 cluster-1 集群中部署 Grafana 并配置数据源。
kubectl apply --context kind-cluster-1 -f grafana.yaml
通过 kubectl port-forward 命令将 Grafana Service 转发到本机 3000 端口提供访问。
kubectl port-forward --context kind-cluster-1 --address 0.0.0.0 svc/grafana-service 3000:3000
浏览器输入 http://<服务器 IP>:3000 访问 Grafana Web 界面。
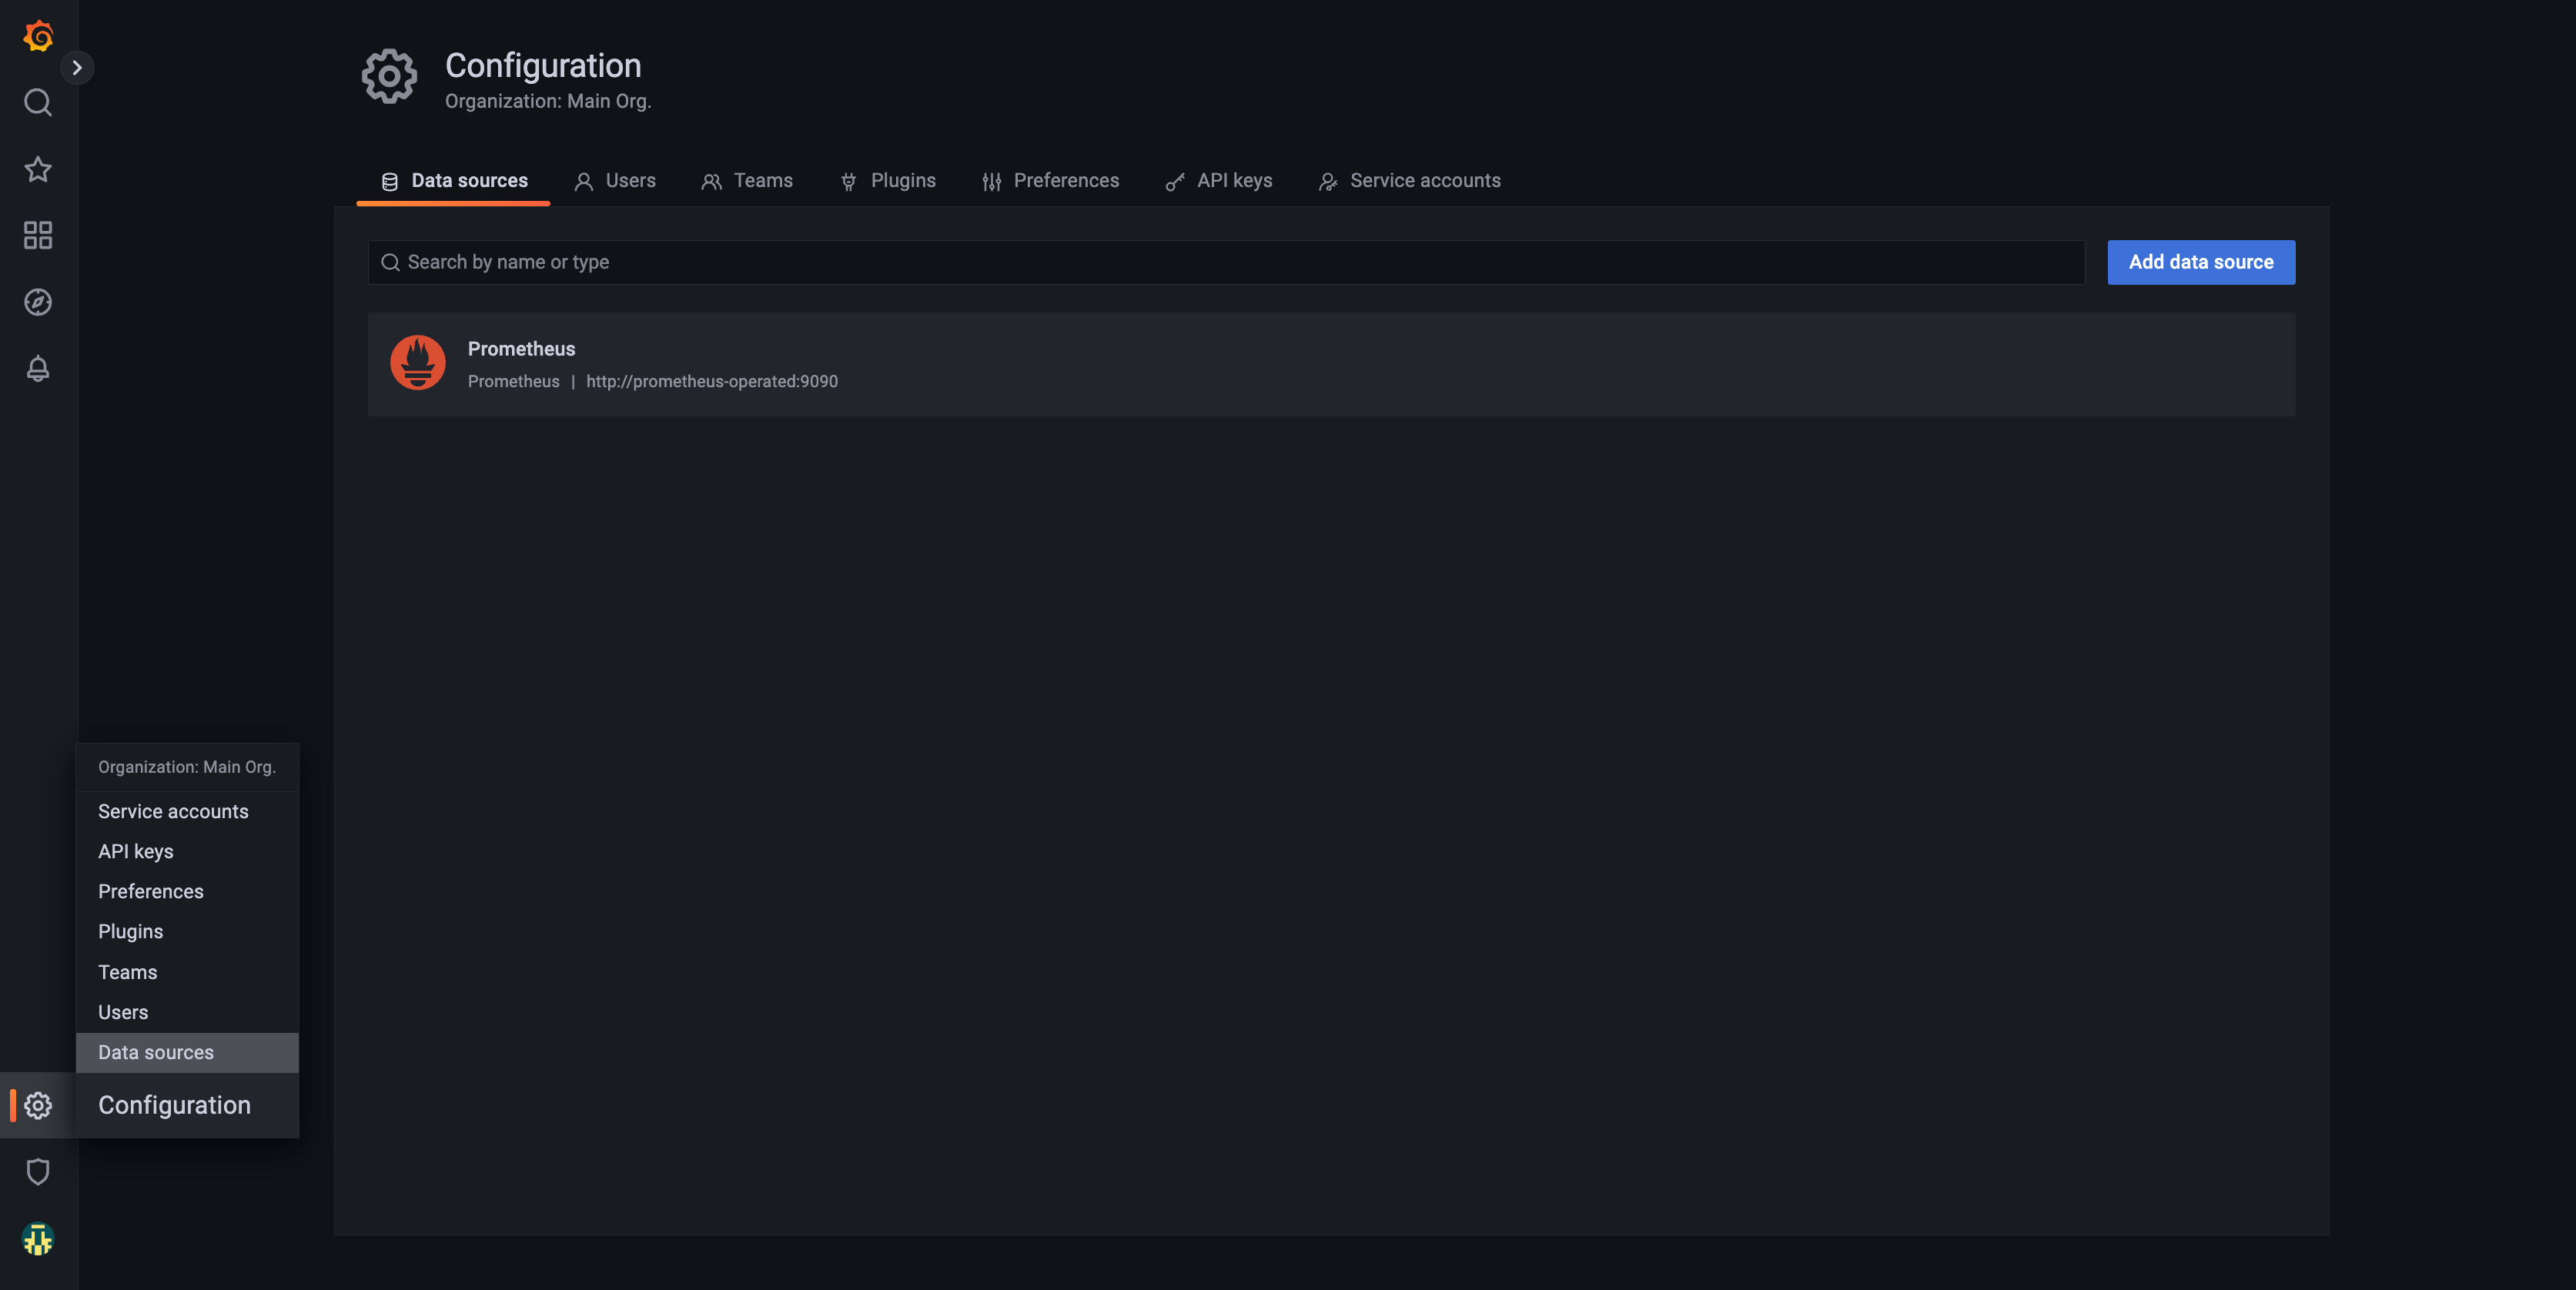
可以看到 Grafana 已经添加了 Prometheus 作为数据源。
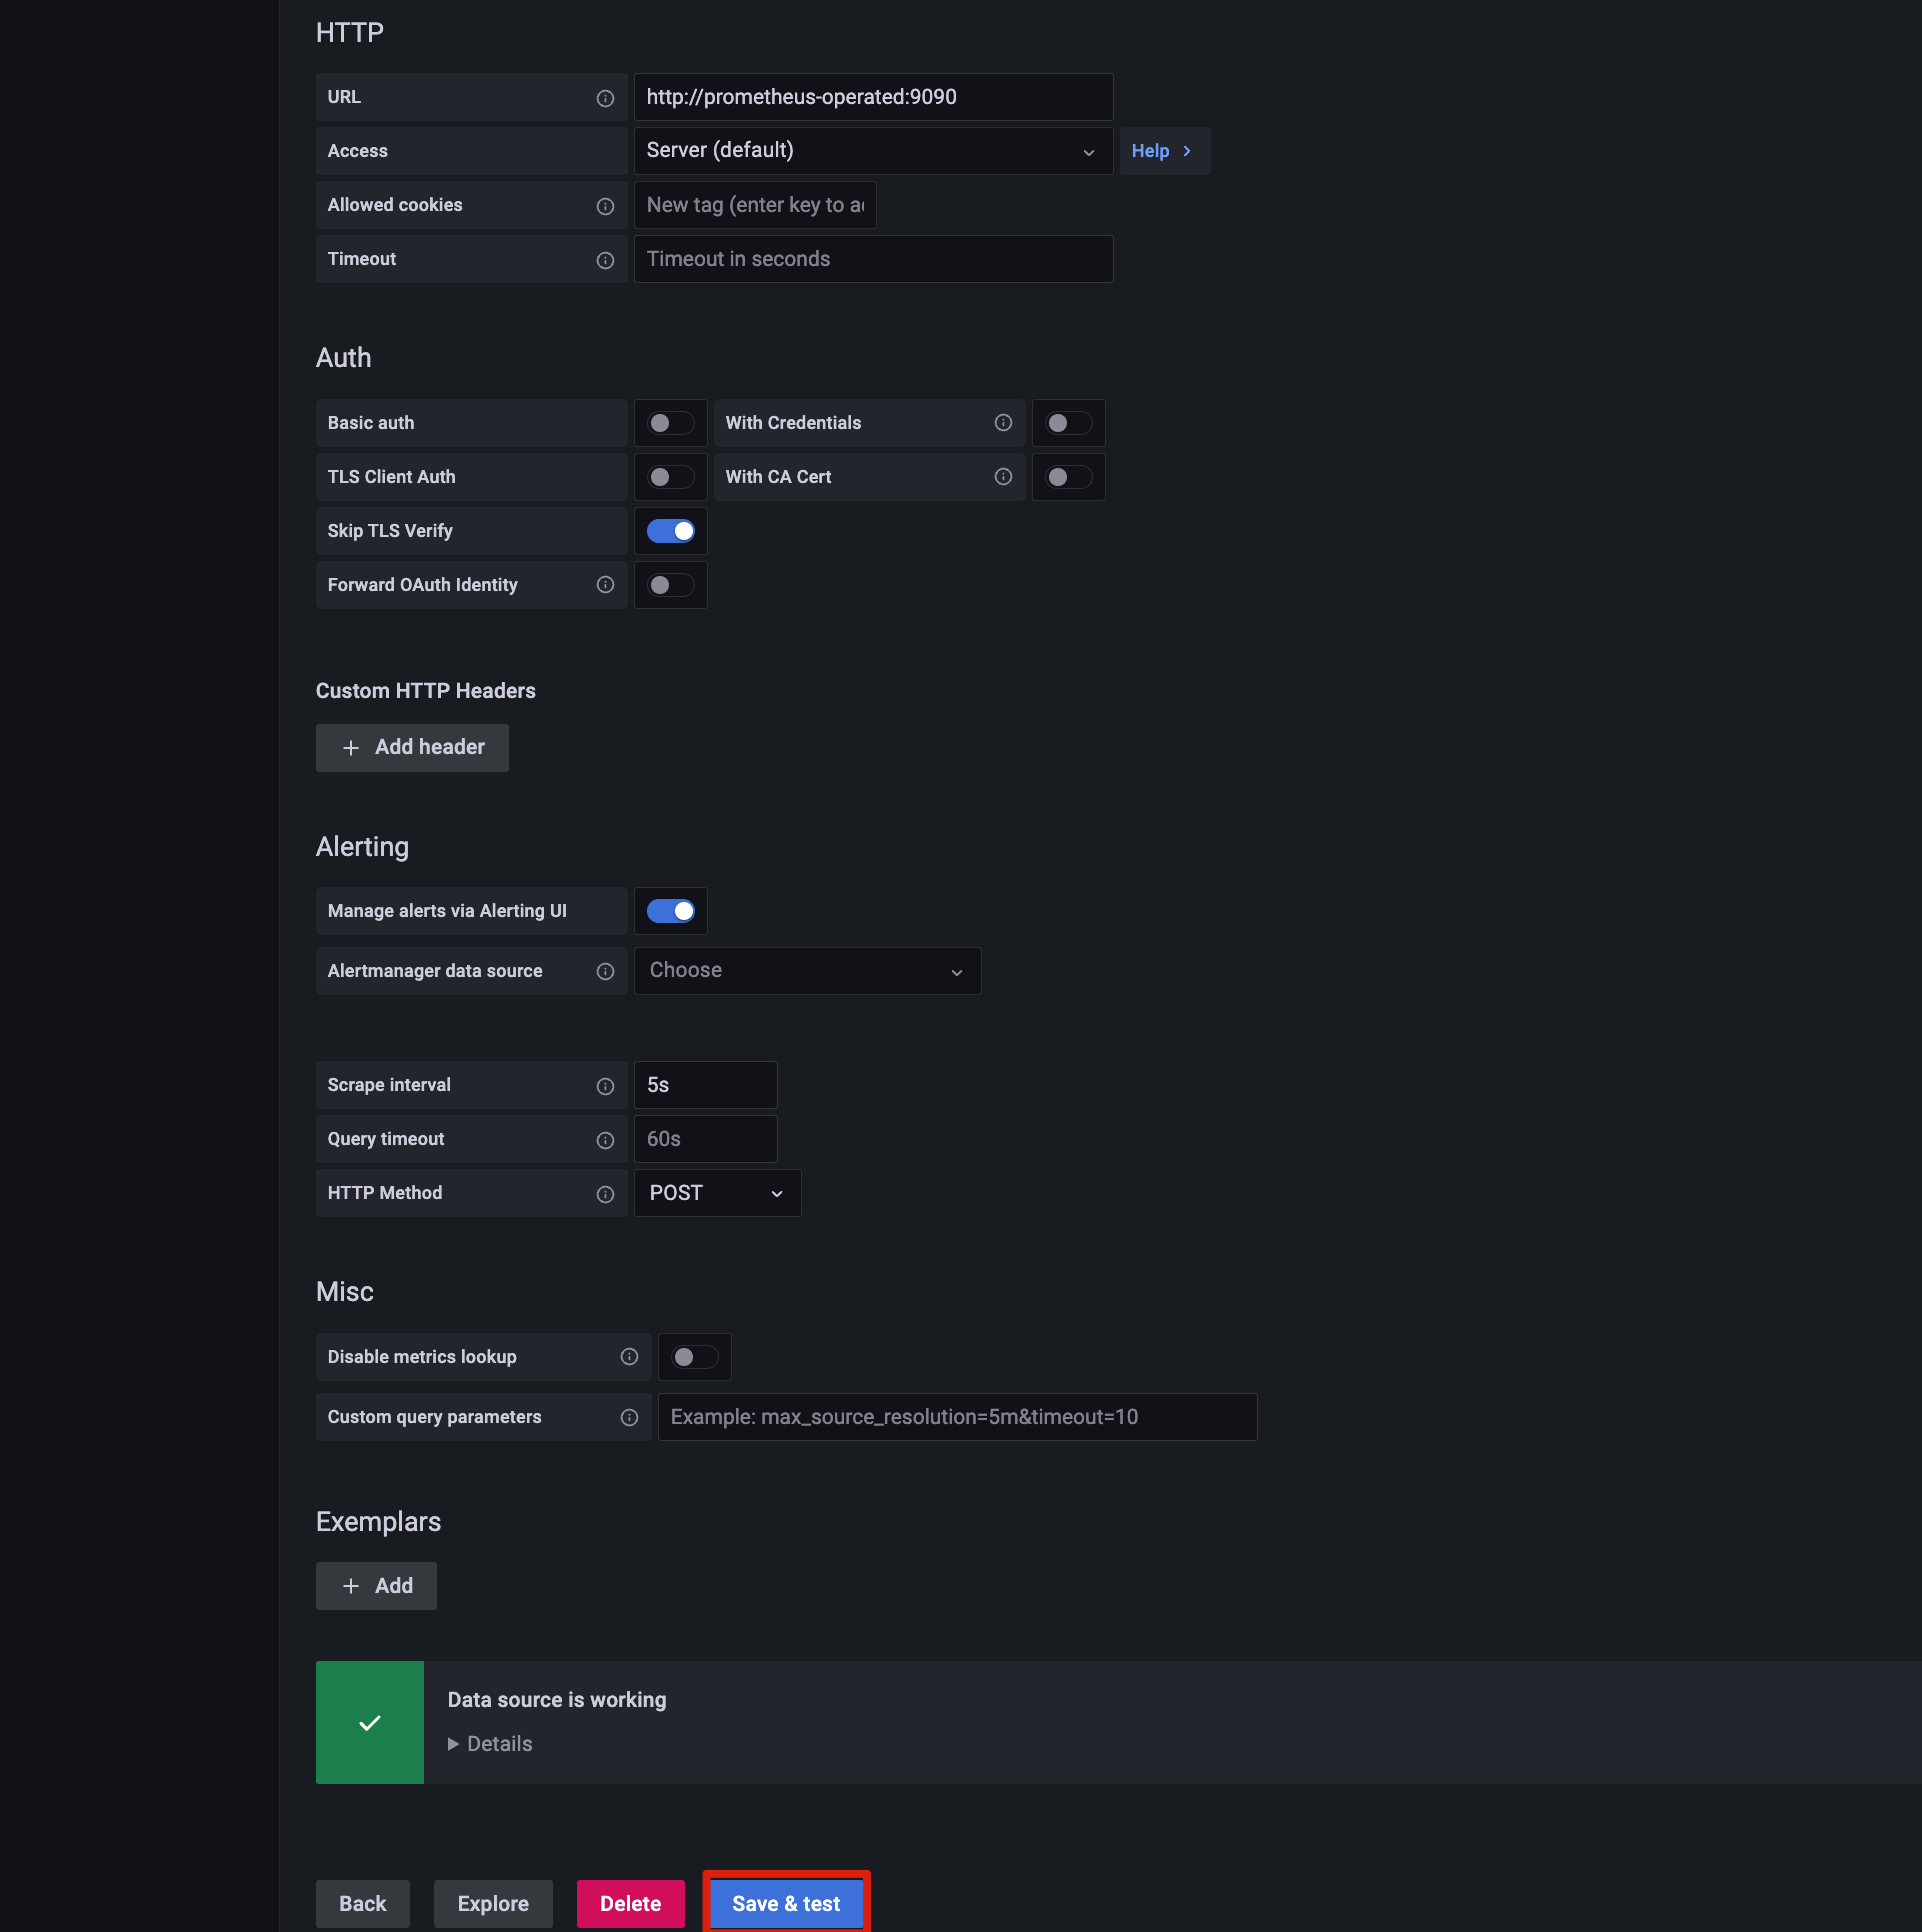
检查数据源是否连接正常。
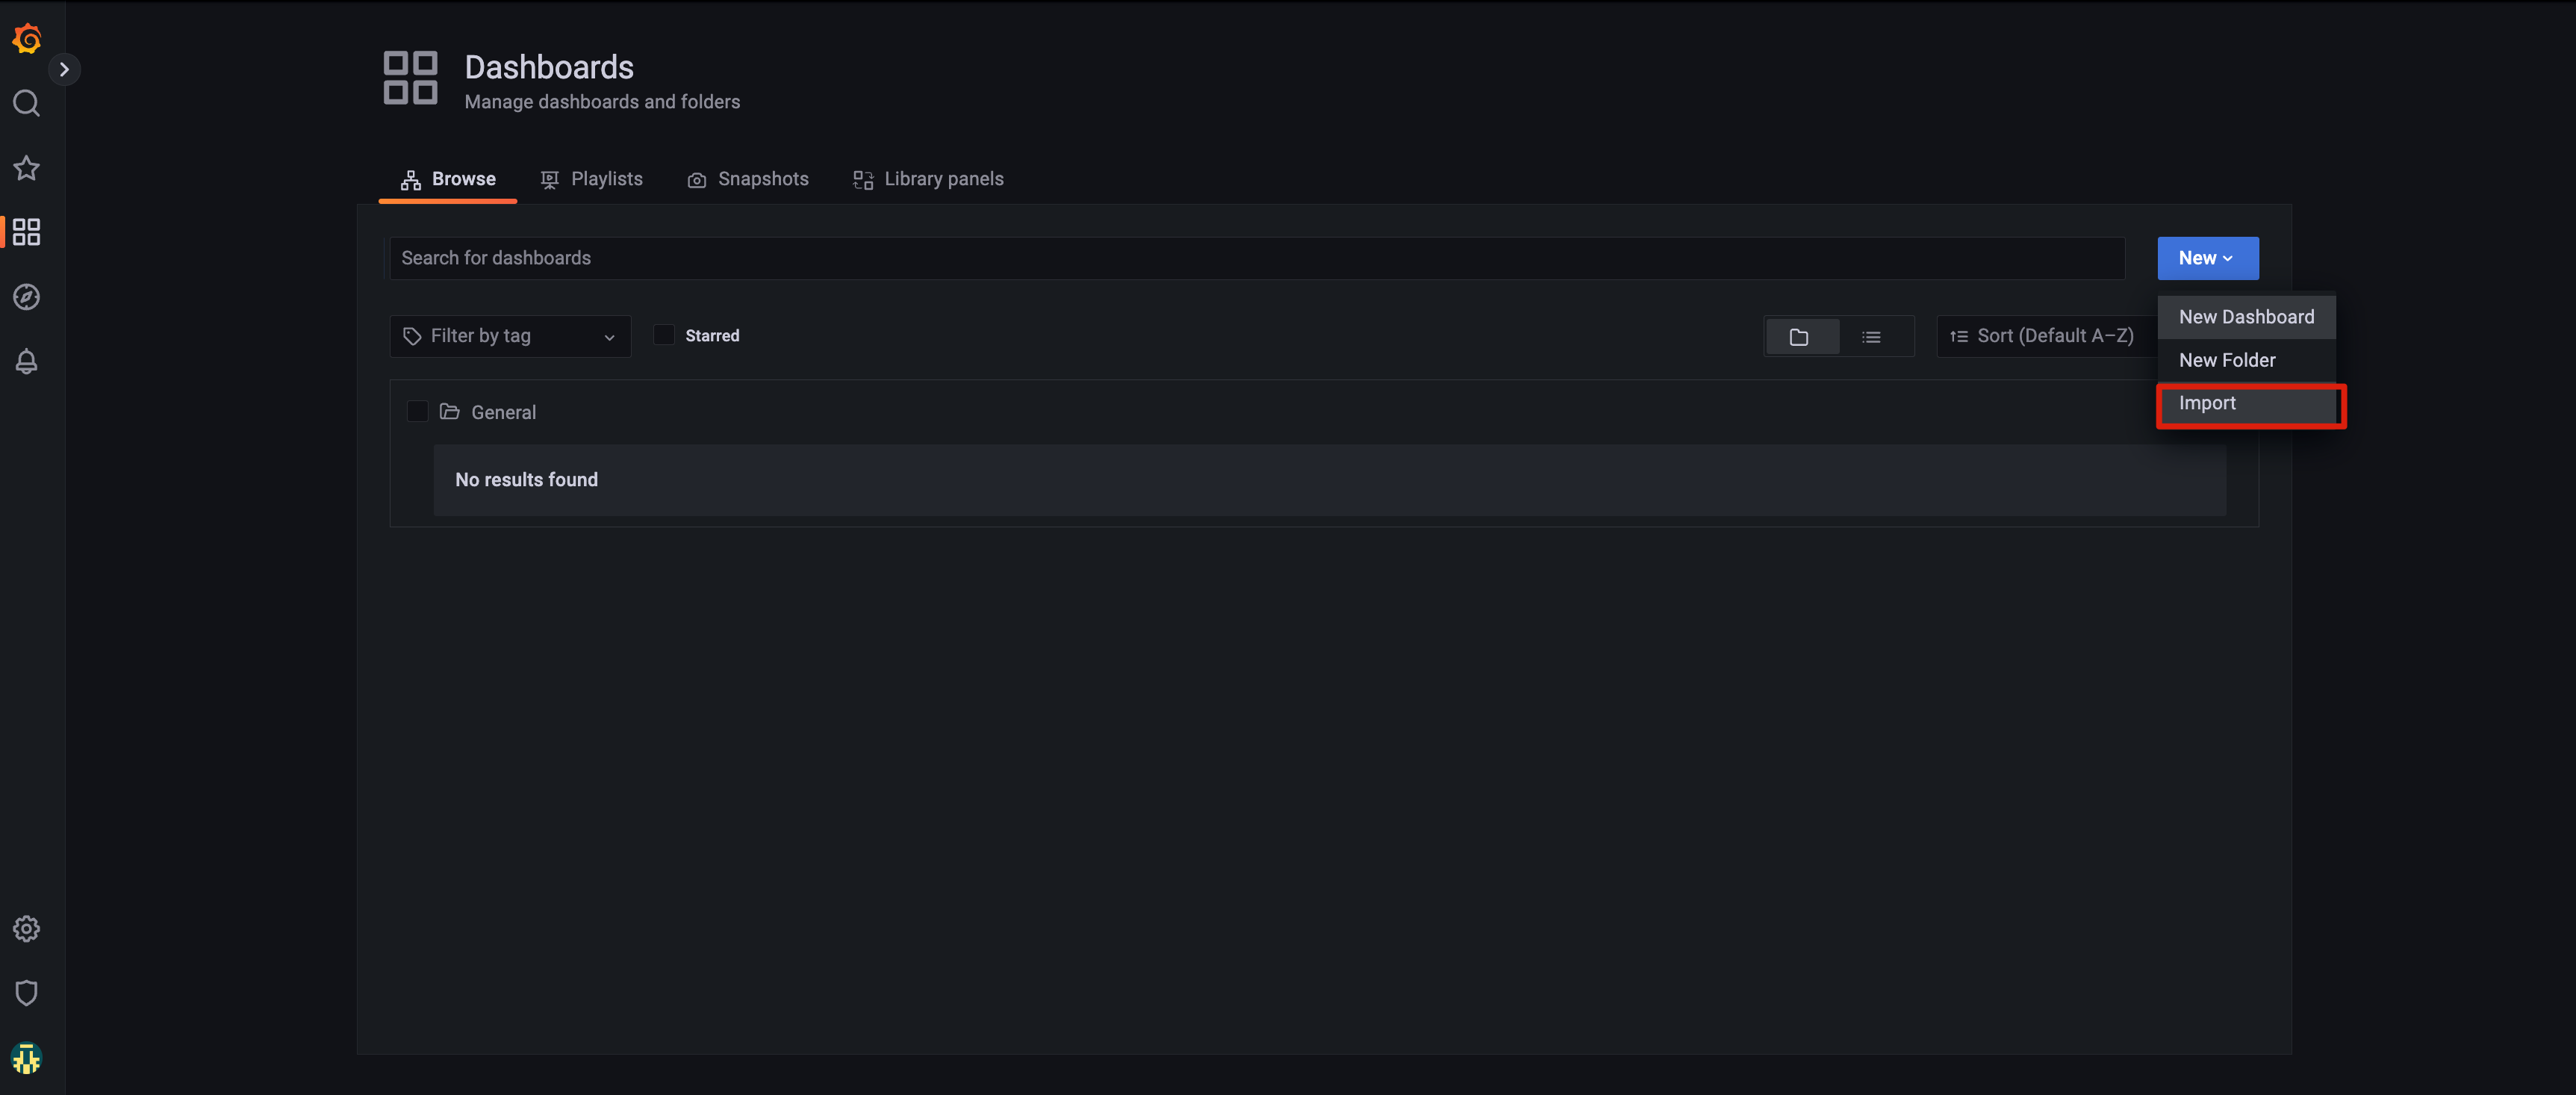
接下来可以直接导入我制作好的 Submariner Dashboard 文件 dashboard.json。
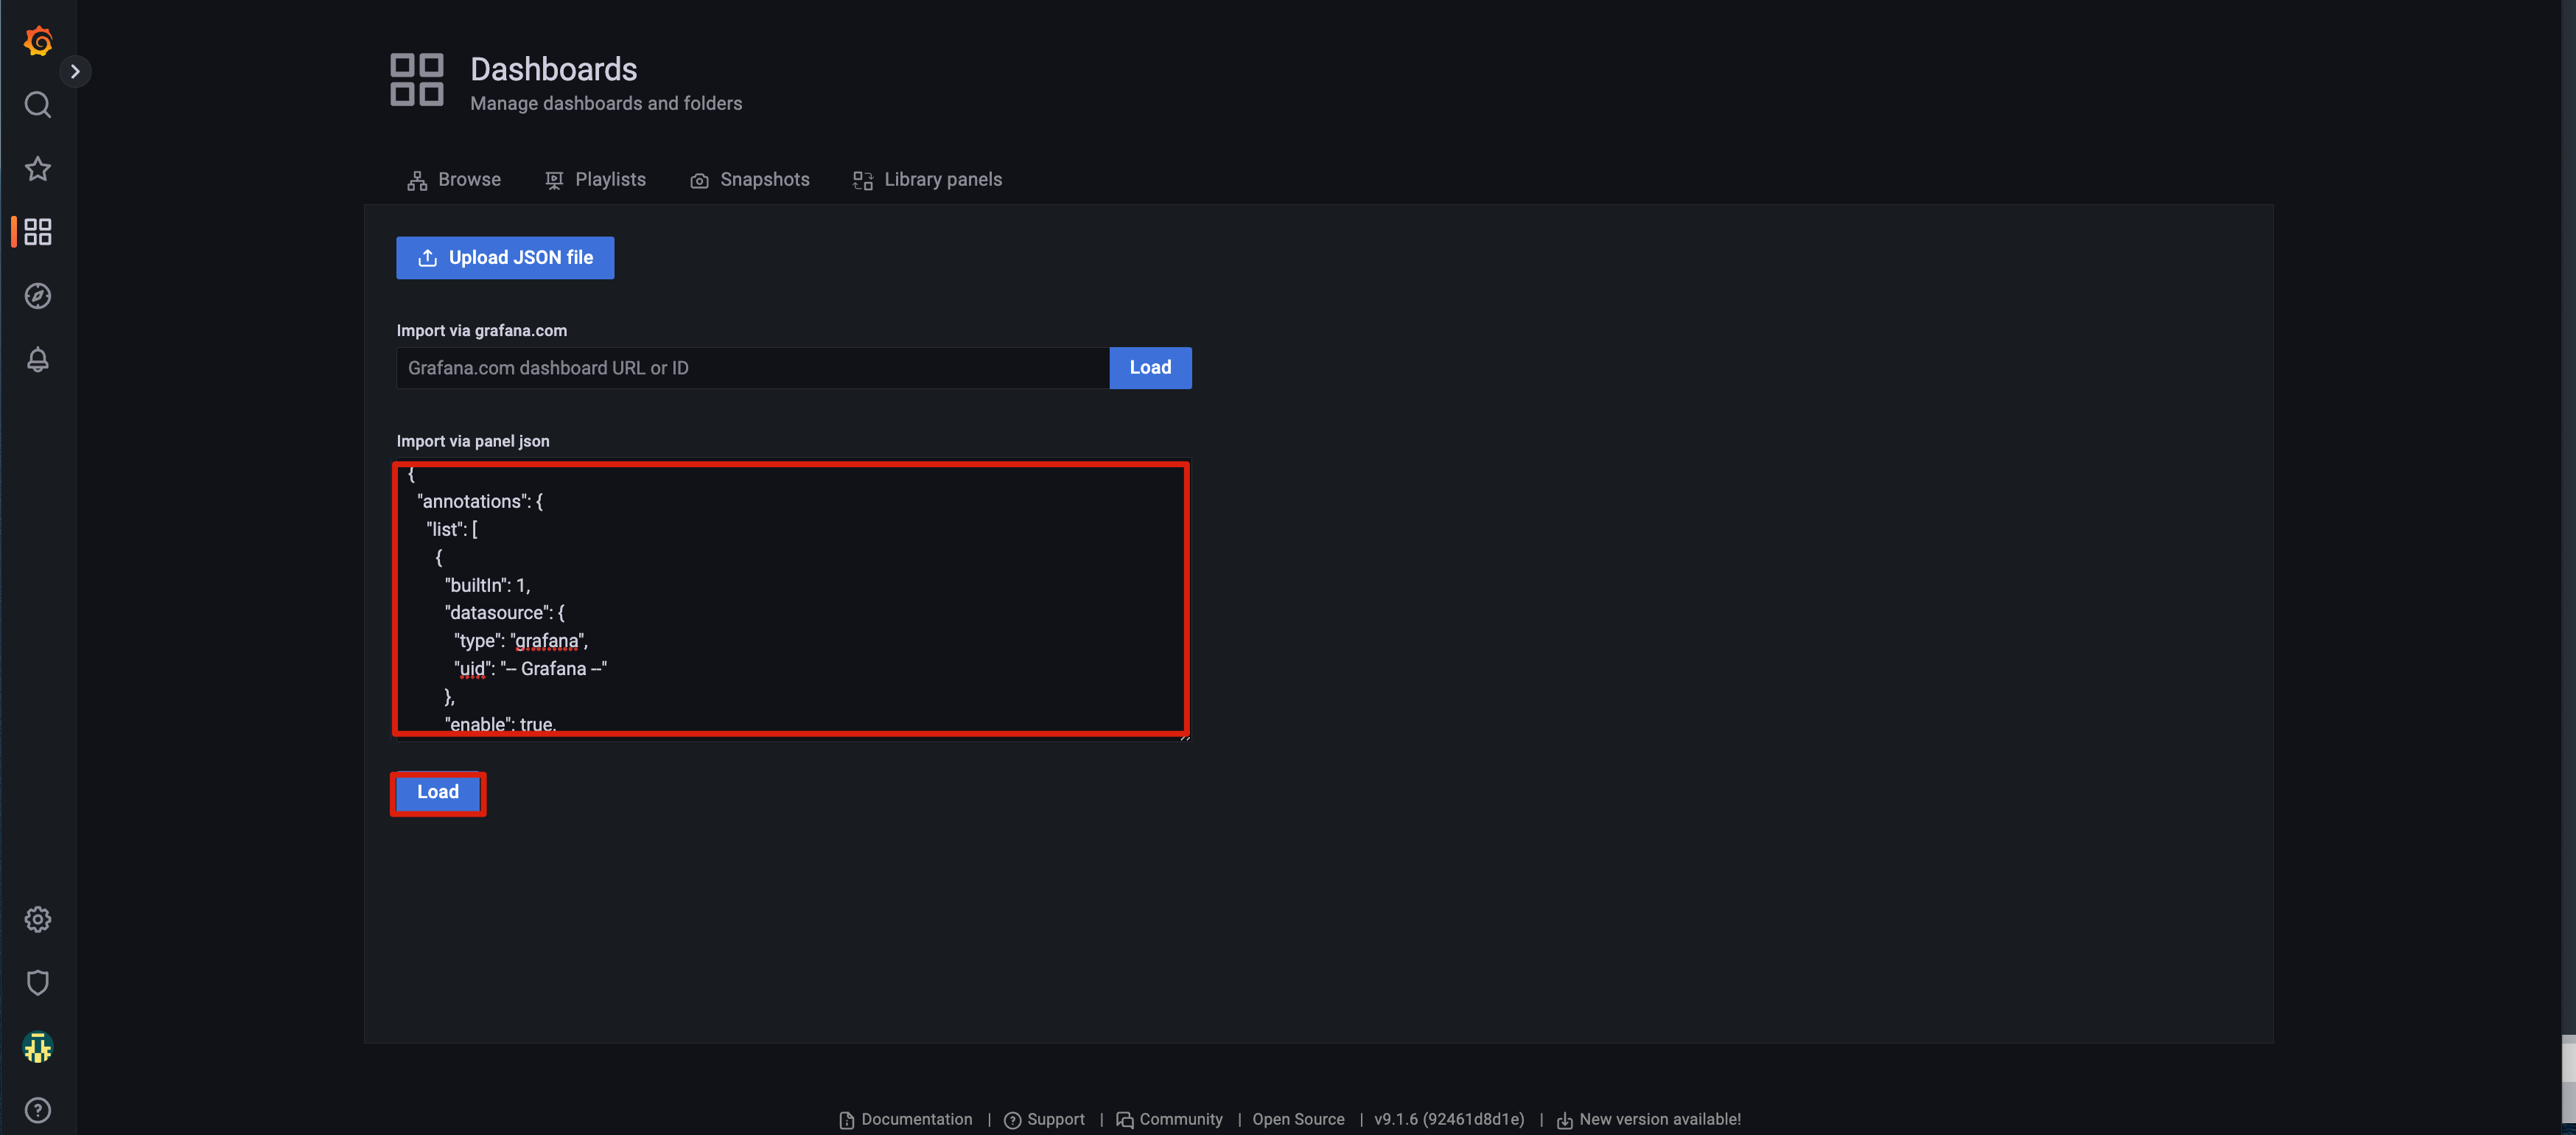
复制并黏贴 dashboard.json 的内容,然后点击 Load 导入。
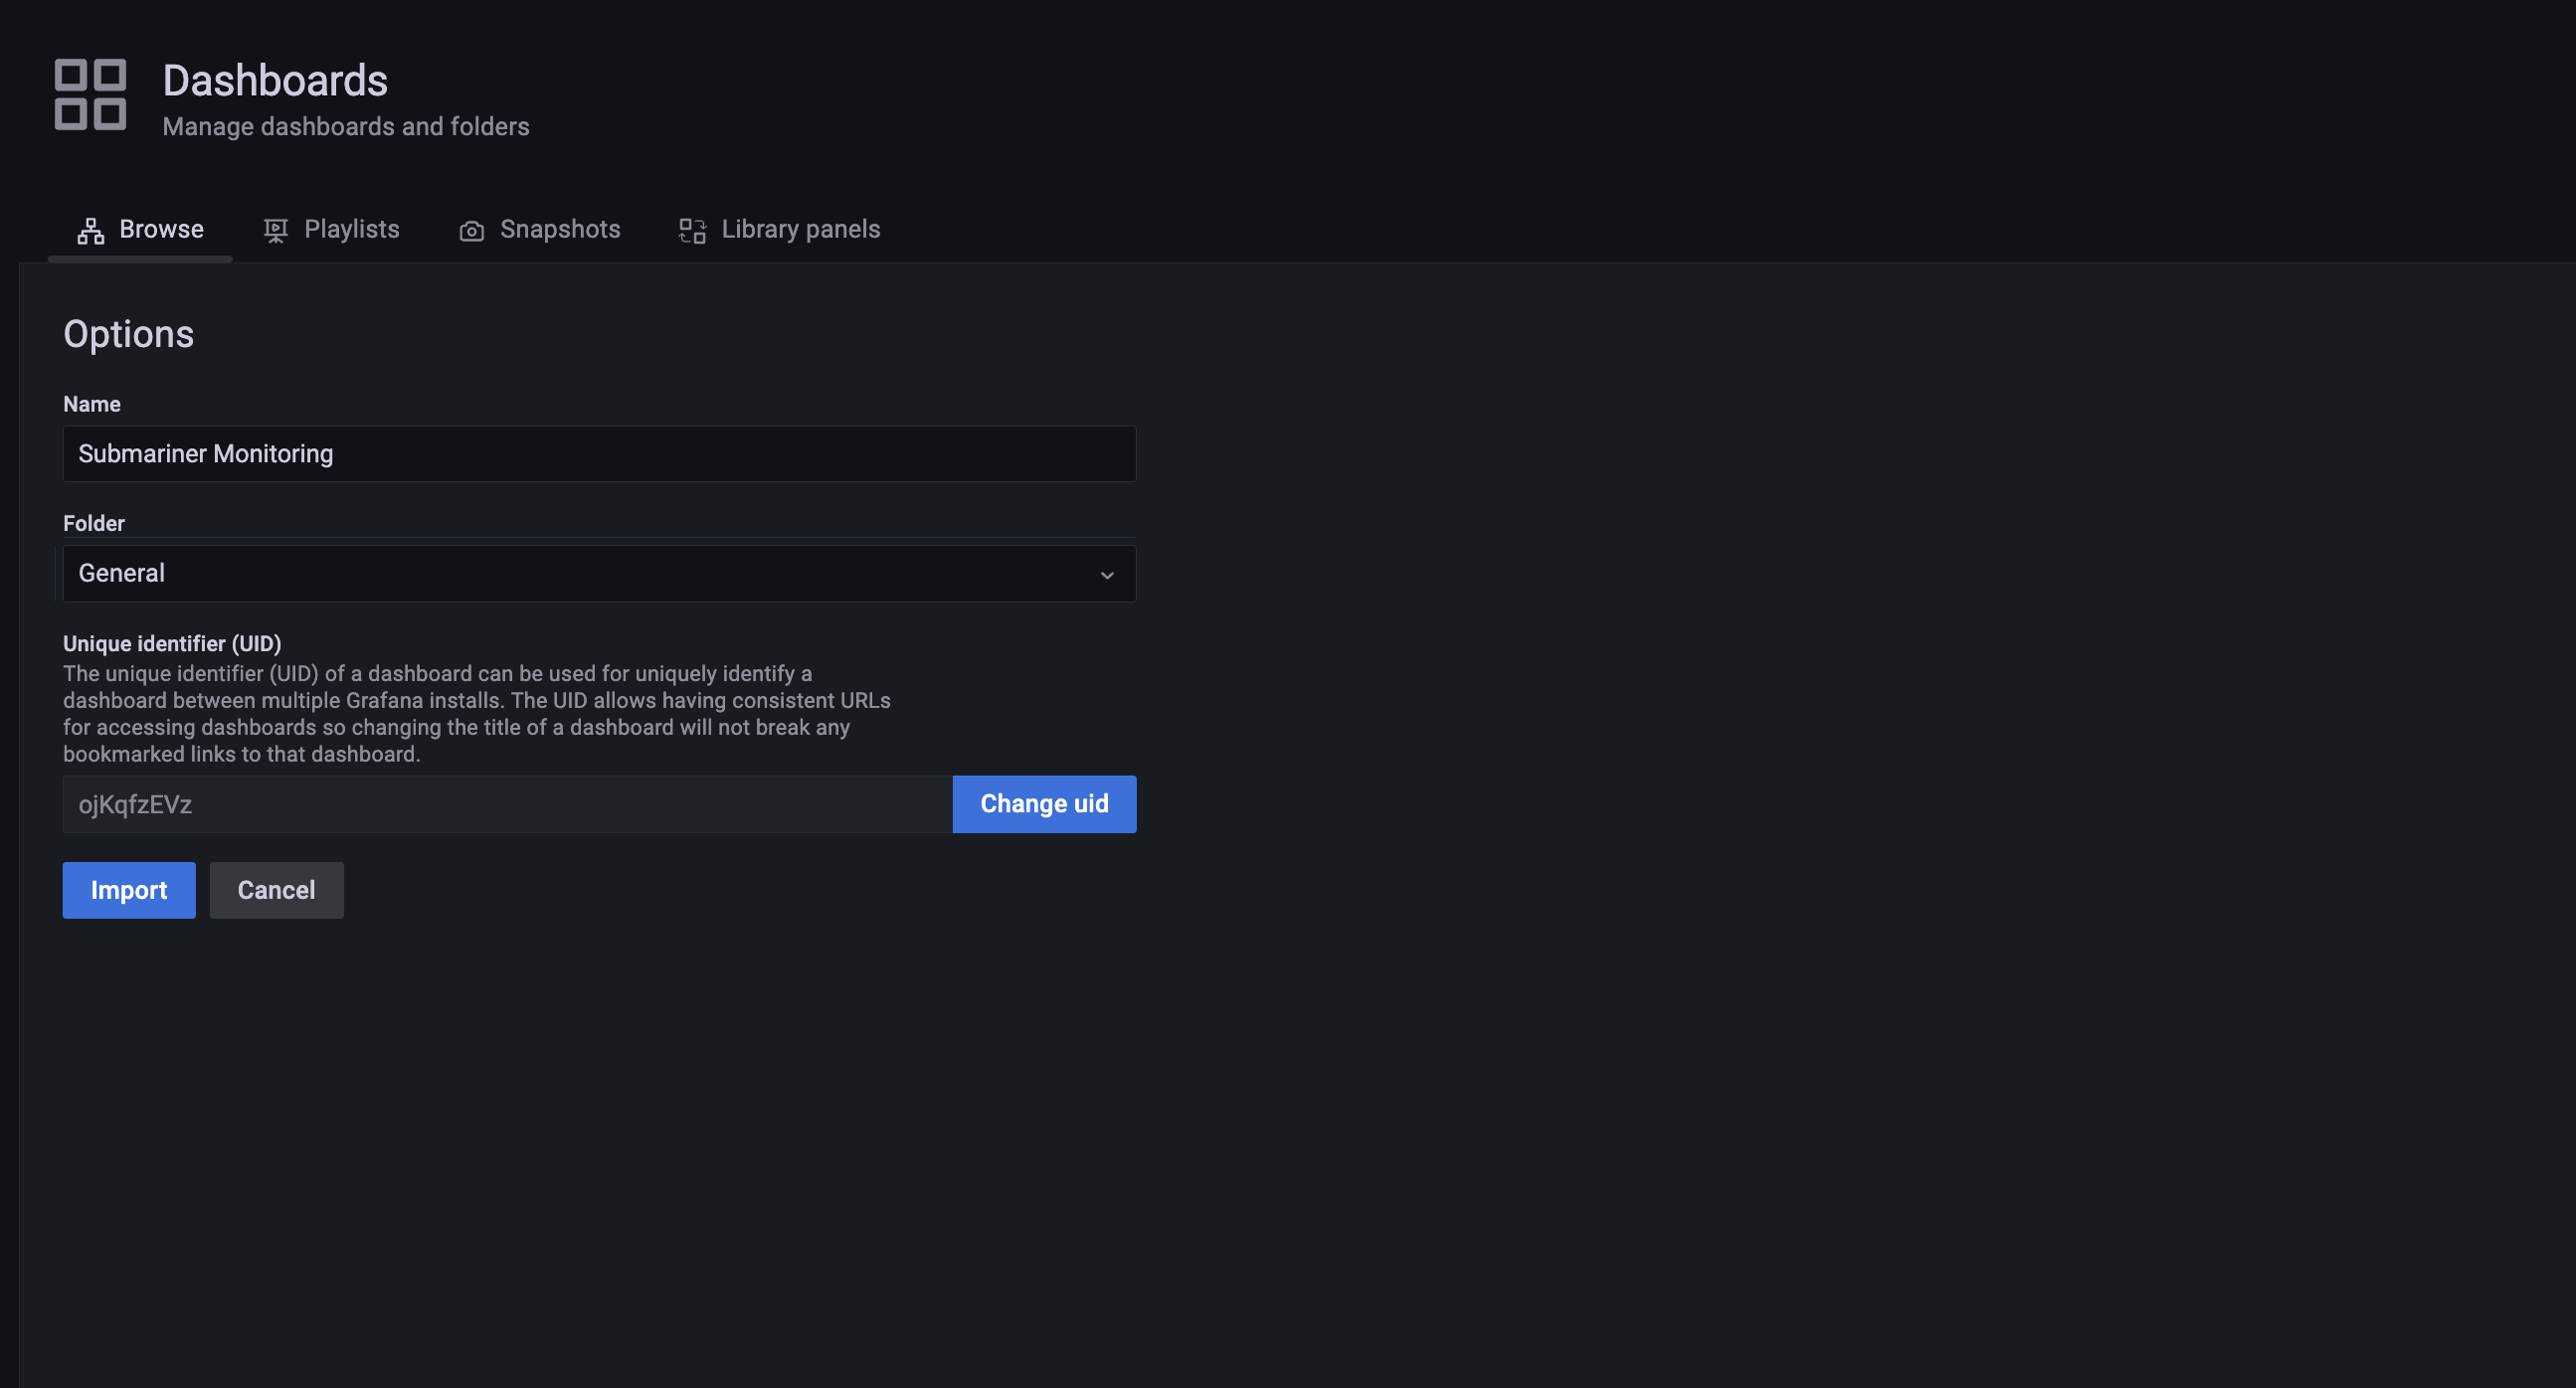
确认 Dashboard 信息,点击 Import 导入。
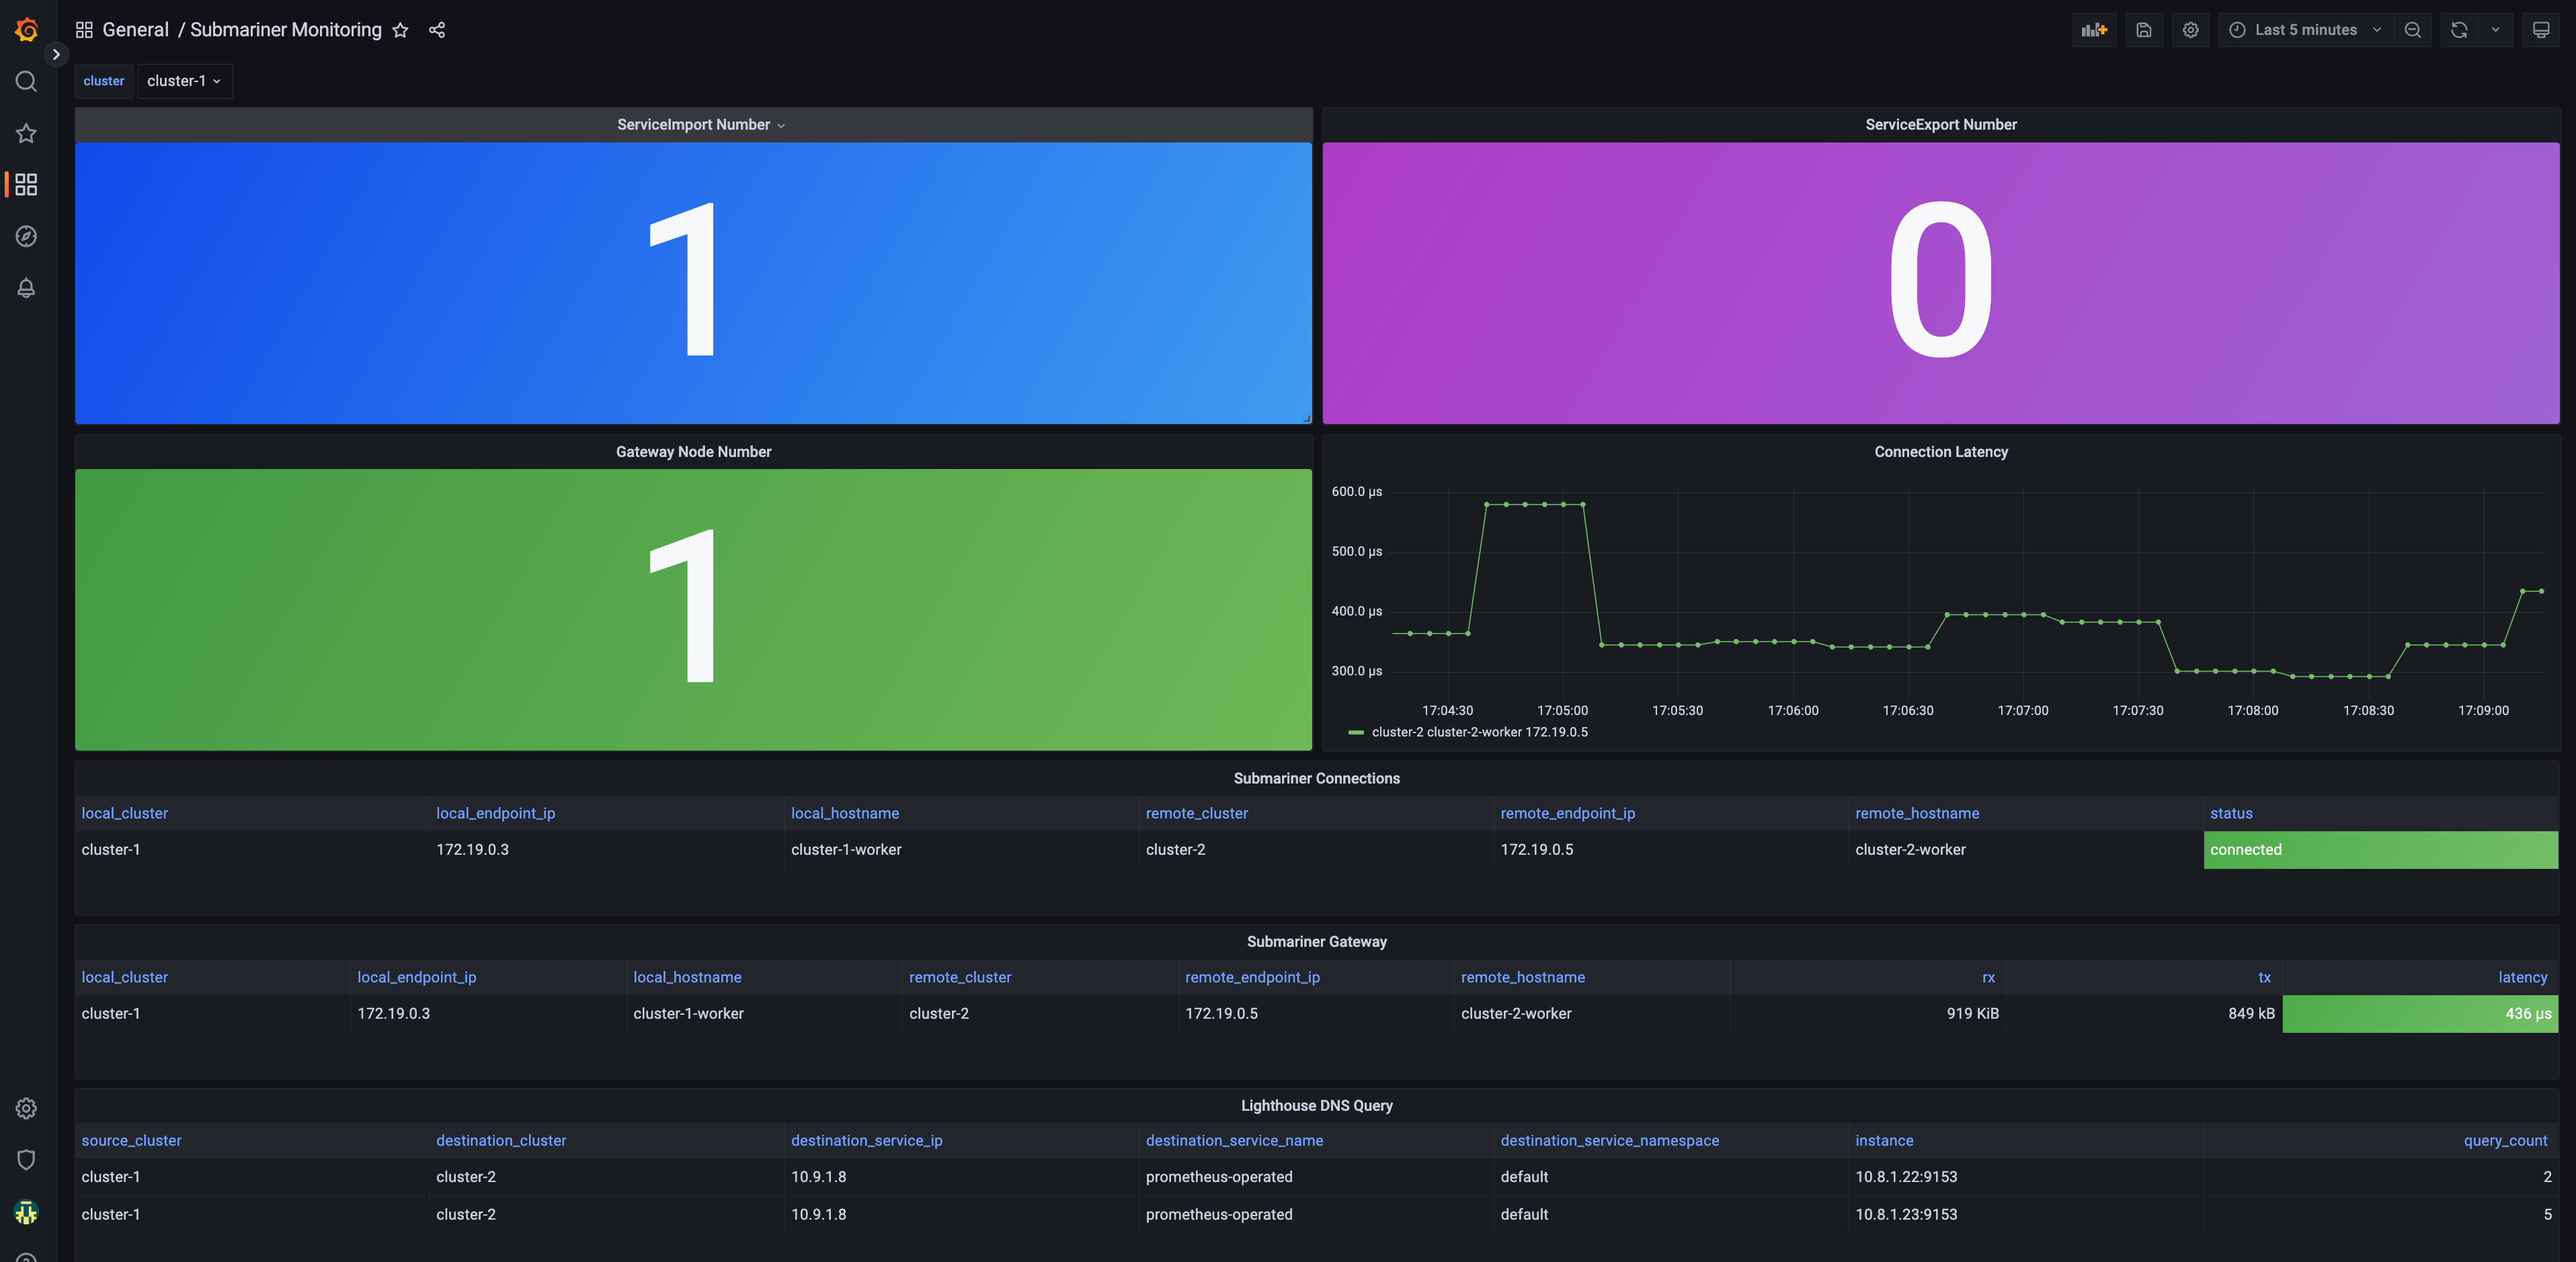
Grafana 展示的最终效果如下:你可以查看 Submariner 集群的连接状态和端点信息,有多少导入和导出的 Service,Gateway 节点的连接延迟情况,以及 Lighthouse DNS 的请求情况等等。
9 总结
在这篇文章里,我们向大家展示了如何运用 Prometheus 来收集与 Submariner 相关的监控指标,并利用 Grafana 以可视化的方式展示监控数据,包括 Submariner 集群间的连接状态、连接延迟以及 DNS 请求等各项指标。此外,我们还借助 Operator 简化了 Prometheus 和 Grafana 的配置与管理过程。最后,文章还阐述了如何通过 Prometheus Federation 将多个集群中的 Prometheus 实例指标汇聚到一个中心集群,以方便查询和展示。
10 参考资料
- Kubernetes Multi-Cluster monitoring with Prometheus and Submariner: https://medium.com/@danielbachar/multi-cluster-monitoring-with-prometheus-and-submariner-f89ff733e7ec
- Prometheus Operator: https://prometheus-operator.dev/
- API Docs: https://github.com/prometheus-operator/prometheus-operator/blob/ca400fdc3edd0af0df896a338eca270e115b74d7/Documentation/api.md#prometheusspec
- Grafana-Operator: https://grafana-operator.github.io/grafana-operator/
- A Beginner’s Guide to Using the Prometheus Operator: https://blog.container-solutions.com/prometheus-operator-beginners-guide
11 欢迎关注
