MATLAB | 绘图复刻(八) | 堆叠柱状图+哑铃图

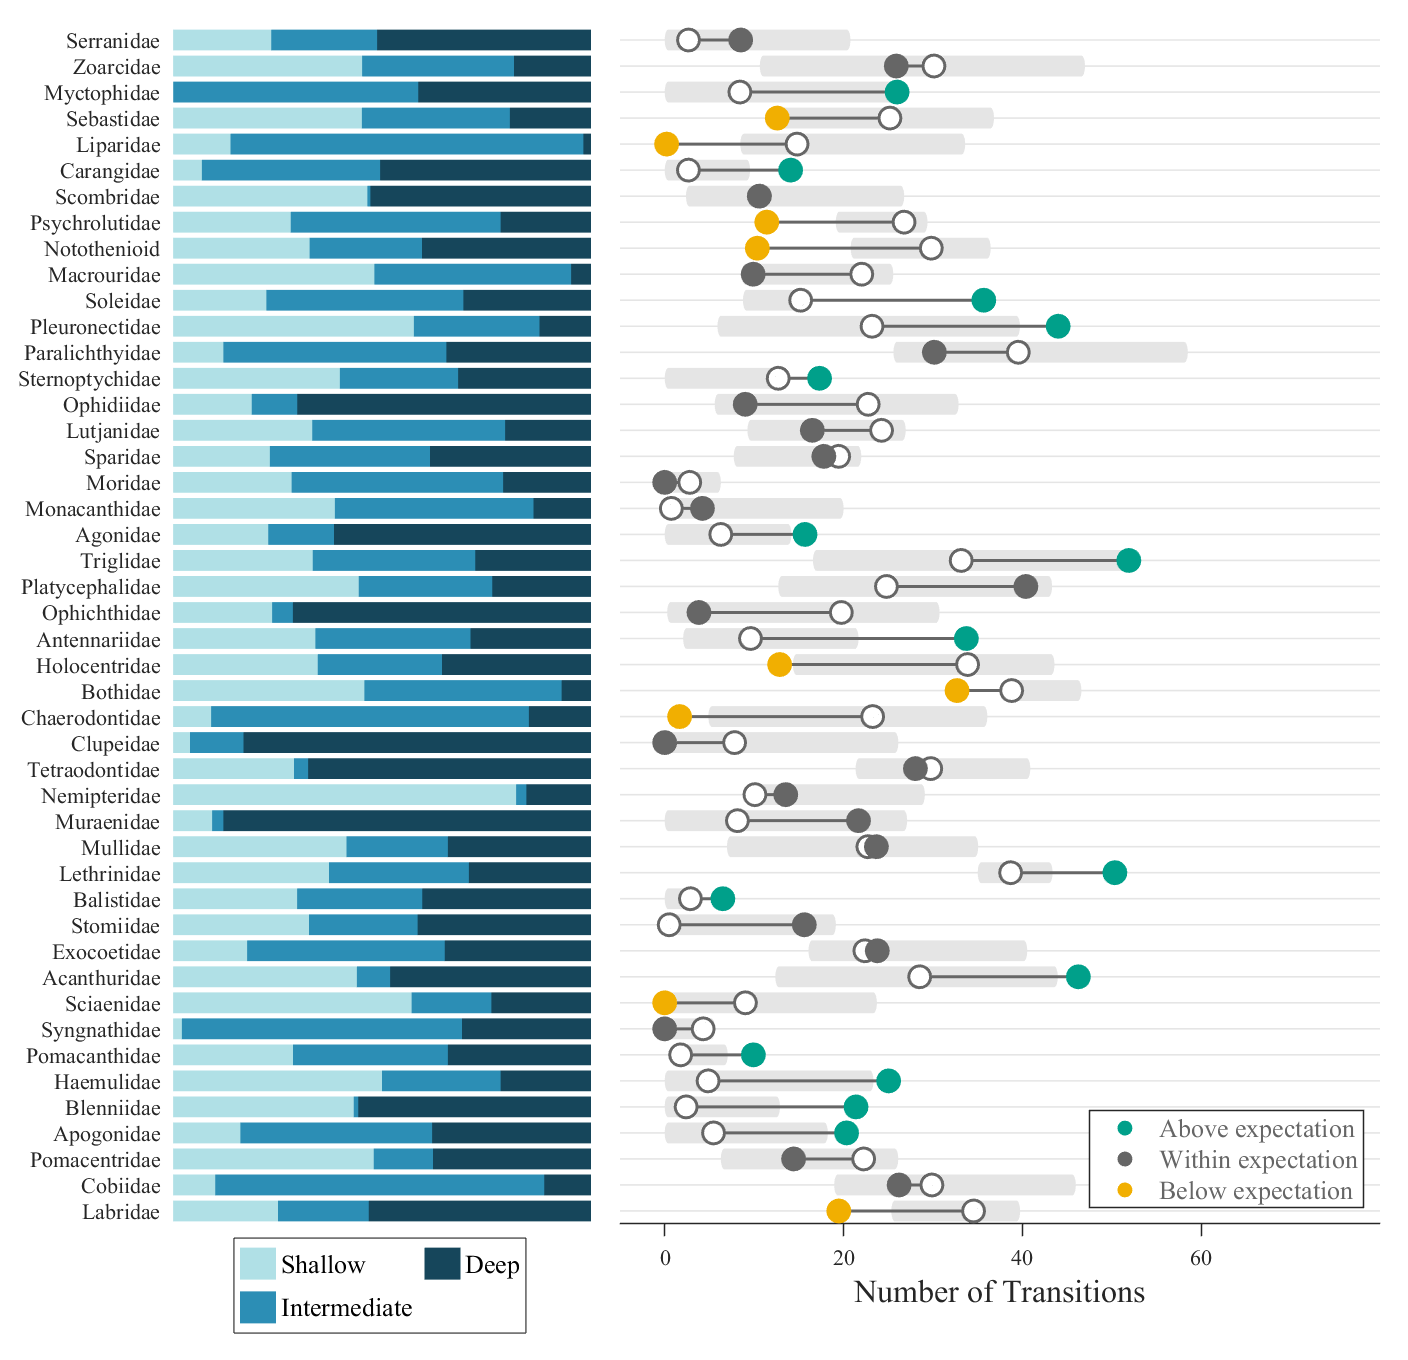
本次复刻的是Nature Communications中Friedman, S.T., Muñoz, M.M. A latitudinal gradient of deep-sea invasions for marine fishes. Nat Commun 14, 773 (2023). https://doi.org/10.1038/s41467-023-36501-4的Fig1图像:

复刻效果:
文章可在如下网站下载pdf文件:
https://www.nature.com/articles/s41467-023-36501-4
同时作者提供了相关绘图的R语言代码,但其绘制代码甚至比MATLAB绘制复杂:
https://github.com/stfriedman/Depth-transitions-paper
仓库并没有提供绘图数据,在datadryad网站提供了原始数据,可以进行下载:
https://datadryad.org/stash/dataset/doi:10.5061/dryad.fc71cp4
这里我们为了方便就随便构造一点数据。
0 数据构造
用以下代码随机生成了一些数据:
rng(1)
% random data
Name={'Serranidae','Zoarcidae','Myctophidae','Sebastidae','Liparidae','Carangidae','Scombridae','Psychrolutidae',...'Notothenioid','Macrouridae','Soleidae','Pleuronectidae','Paralichthyidae','Sternoptychidae','Ophidiidae',...'Lutjanidae','Sparidae','Moridae','Monacanthidae','Agonidae','Triglidae','Platycephalidae','Ophichthidae',...'Antennariidae','Holocentridae','Bothidae','Chaerodontidae','Clupeidae','Tetraodontidae','Nemipteridae',...'Muraenidae','Mullidae','Lethrinidae','Balistidae','Stomiidae','Exocoetidae','Acanthuridae','Sciaenidae',...'Syngnathidae','Pomacanthidae','Haemulidae','Blenniidae','Apogonidae','Pomacentridae','Cobiidae','Labridae'}.';
N=size(Name,1);
RatioData=rand(N,3);
RatioData=RatioData./sum(RatioData,2);
%
Shallow=RatioData(:,1);
Deep=RatioData(:,2);
Intermediate=RatioData(:,3);
%
Median=rand(N,1).*40;
High=Median+rand(N,1).*20;
Low=Median-rand(N,1).*20;
Low(Low<0)=0;
%
Exact=rand(N,1).*50-25+Median;
Exact(Exact<0)=0;
%
T=table(Name,Shallow,Deep,Intermediate,Median,Low,High,Exact)
writetable(T,'ta_results_revisions_data.csv')
运行结果会存在ta_results_revisions_data.csv文件夹内,数据大概长这样:
% 46×8 table
%
%         Name            Shallow        Deep      Intermediate    Median     Low       High      Exact
%   _________________    __________    ________    ____________    ______    ______    ______    _______
%
%   {'Serranidae'   }       0.23487     0.51173        0.2534      34.542    25.344    39.748      19.47
%   {'Zoarcidae'    }       0.45237     0.18439       0.36324      29.885    18.958     45.98      26.22
%   {'Myctophidae'  }    0.00016433     0.41345       0.58638       22.25    6.2775    26.118     14.417
%   {'Sebastidae'   }       0.45166     0.19425       0.35409      5.4582         0    18.247      20.34
%   {'Liparidae'    }       0.13722    0.018108       0.84467      2.3967         0     12.89     21.397
%
%           :                :            :             :            :         :         :          :
%
%   {'Blenniidae'   }       0.43205     0.55718      0.010768      14.803    8.4557    33.606    0.21309
%   {'Apogonidae'   }       0.16076      0.3803       0.45894      25.189     12.75    36.829      12.59
%   {'Pomacentridae'}       0.48011     0.37817       0.14172       8.407         0    25.984     25.991
%   {'Cobiidae'     }        0.1007     0.11194       0.78736       30.11    10.634    47.005     25.903
%   {'Labridae'     }       0.25089     0.53185       0.21726      2.6615         0    20.769     8.4957
1 数据导入
就readtable,没啥技术含量:
% 数据导入
Data=readtable('ta_results_revisions_data.csv');
[N,~]=size(Data);
2 图窗及坐标区域创建
% figure窗口及axes坐标区域创建
fig=figure('Units','normalized','Position',[.1,.05,.55,.85],'Color',[1,1,1]);
% -------------------------------------------------------------------------
% 左侧柱状图axes
ax1=axes(fig);
ax1.NextPlot='add';
ax1.Position=[.12,.1,.3,.88];
ax1.XLim=[-.01,1];
ax1.YLim=[.5,N+.5];
plot(ax1,[-.01,-.01],[.5,N+.5],'Color',[1,1,1],'LineWidth',2)
ax1.YTick=1:N;
ax1.TickLength=[1e-5,14-5];
ax1.YTickLabel=Data.Name;
ax1.YDir='reverse';
ax1.XColor='none';
ax1.FontName='Times New Roman';
ax1.FontSize=11;
% -------------------------------------------------------------------------
ax2=axes(fig);
ax2.NextPlot='add';
ax2.Position=[.44,.1,.54,.88];
ax2.FontName='Times New Roman';
ax2.YColor='none';
ax2.XLim=[-5,80];
ax2.YLim=[.5,N+.5];
ax2.XTick=[0,20,40,60];
ax2.LineWidth=.8;
ax2.TickDir='out';
ax2.FontSize=11;
ax2.XLabel.String='Number of Transitions';
ax2.XLabel.FontSize=16;

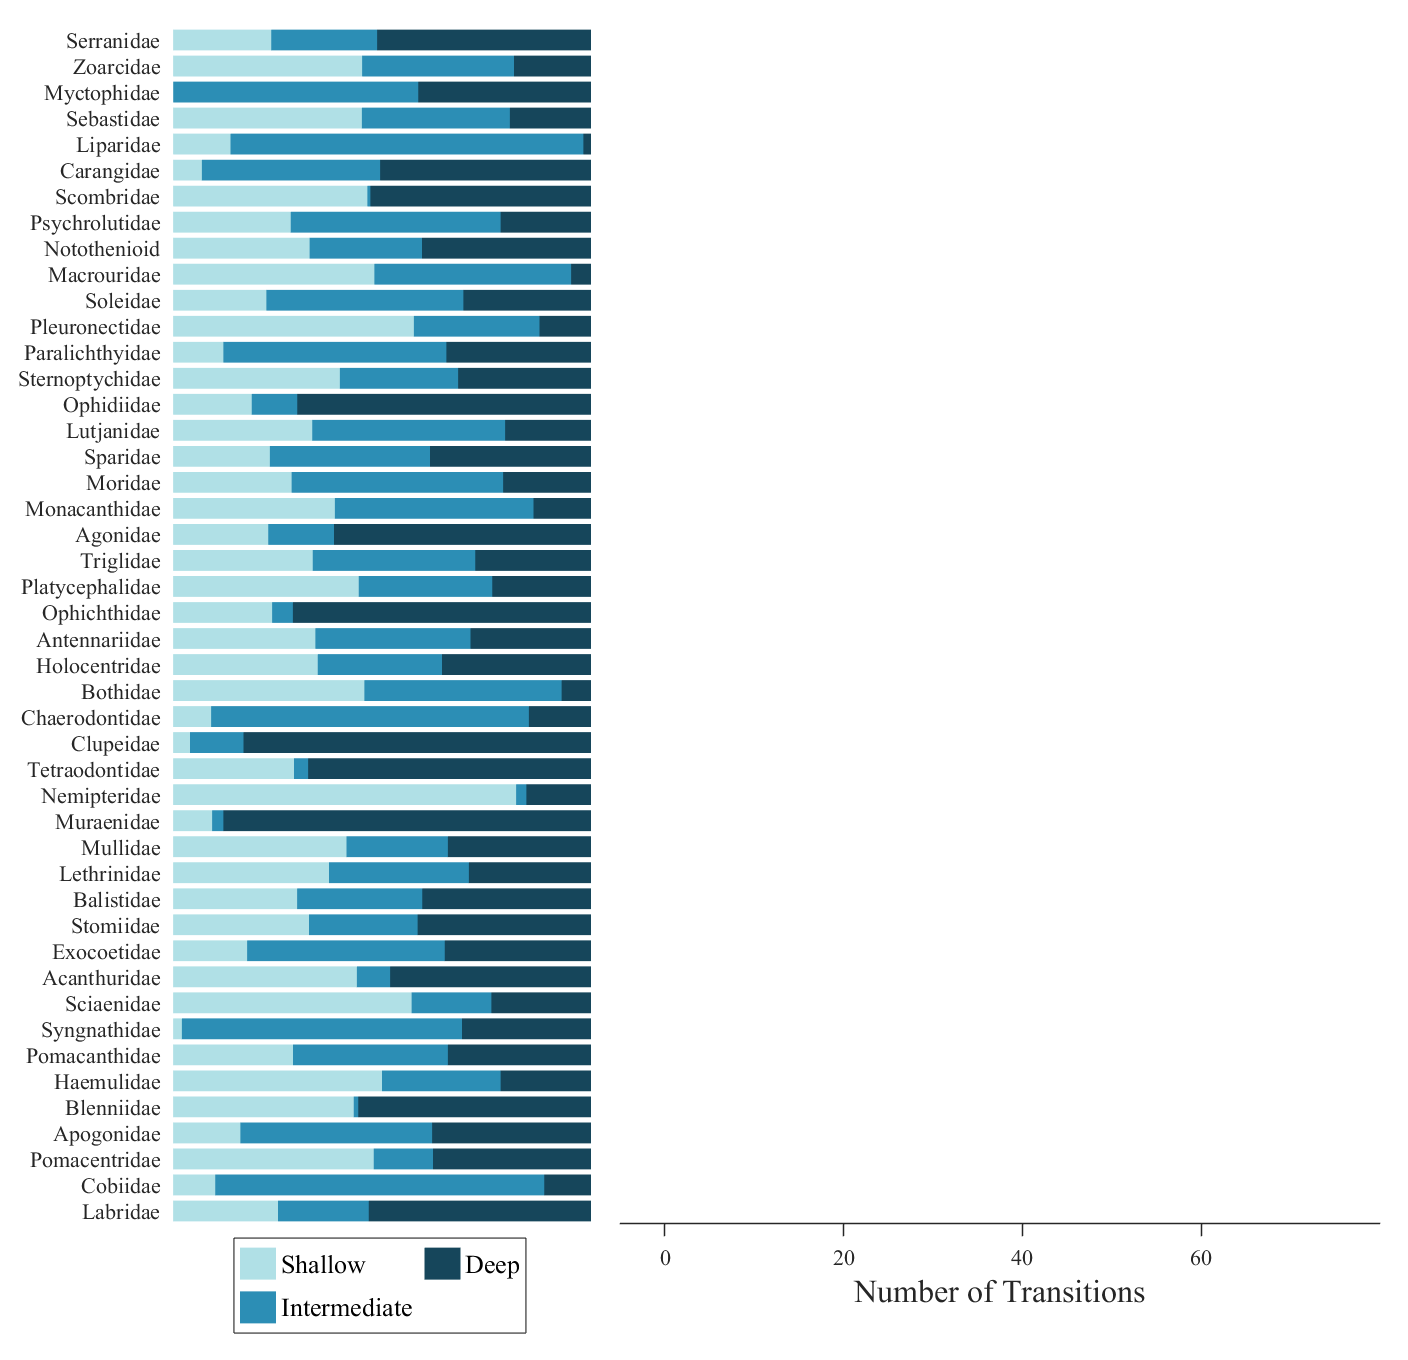
3 堆叠柱状图绘制并改颜色
非常简单,主要需要添加stacked属性:
% 左侧堆叠柱状图绘制
barhHdl=barh(ax1,[Data.Shallow,Data.Intermediate,Data.Deep],'stacked');
% 修改配色
barhHdl(1).EdgeColor='none';
barhHdl(2).EdgeColor='none';
barhHdl(3).EdgeColor='none';
barhHdl(1).FaceColor=[176,224,230]./255;
barhHdl(2).FaceColor=[44,142,181]./255;
barhHdl(3).FaceColor=[22,70,91]./255;

顺便画个图例:
% 绘制图例
lgd1Hdl=legend(ax1,barhHdl,{'Shallow','Intermediate','Deep'});
lgd1Hdl.NumColumns=2;
lgd1Hdl.ItemTokenSize=[18,18];
lgd1Hdl.Position=[.17,.02,.2,.07];
lgd1Hdl.FontSize=13;
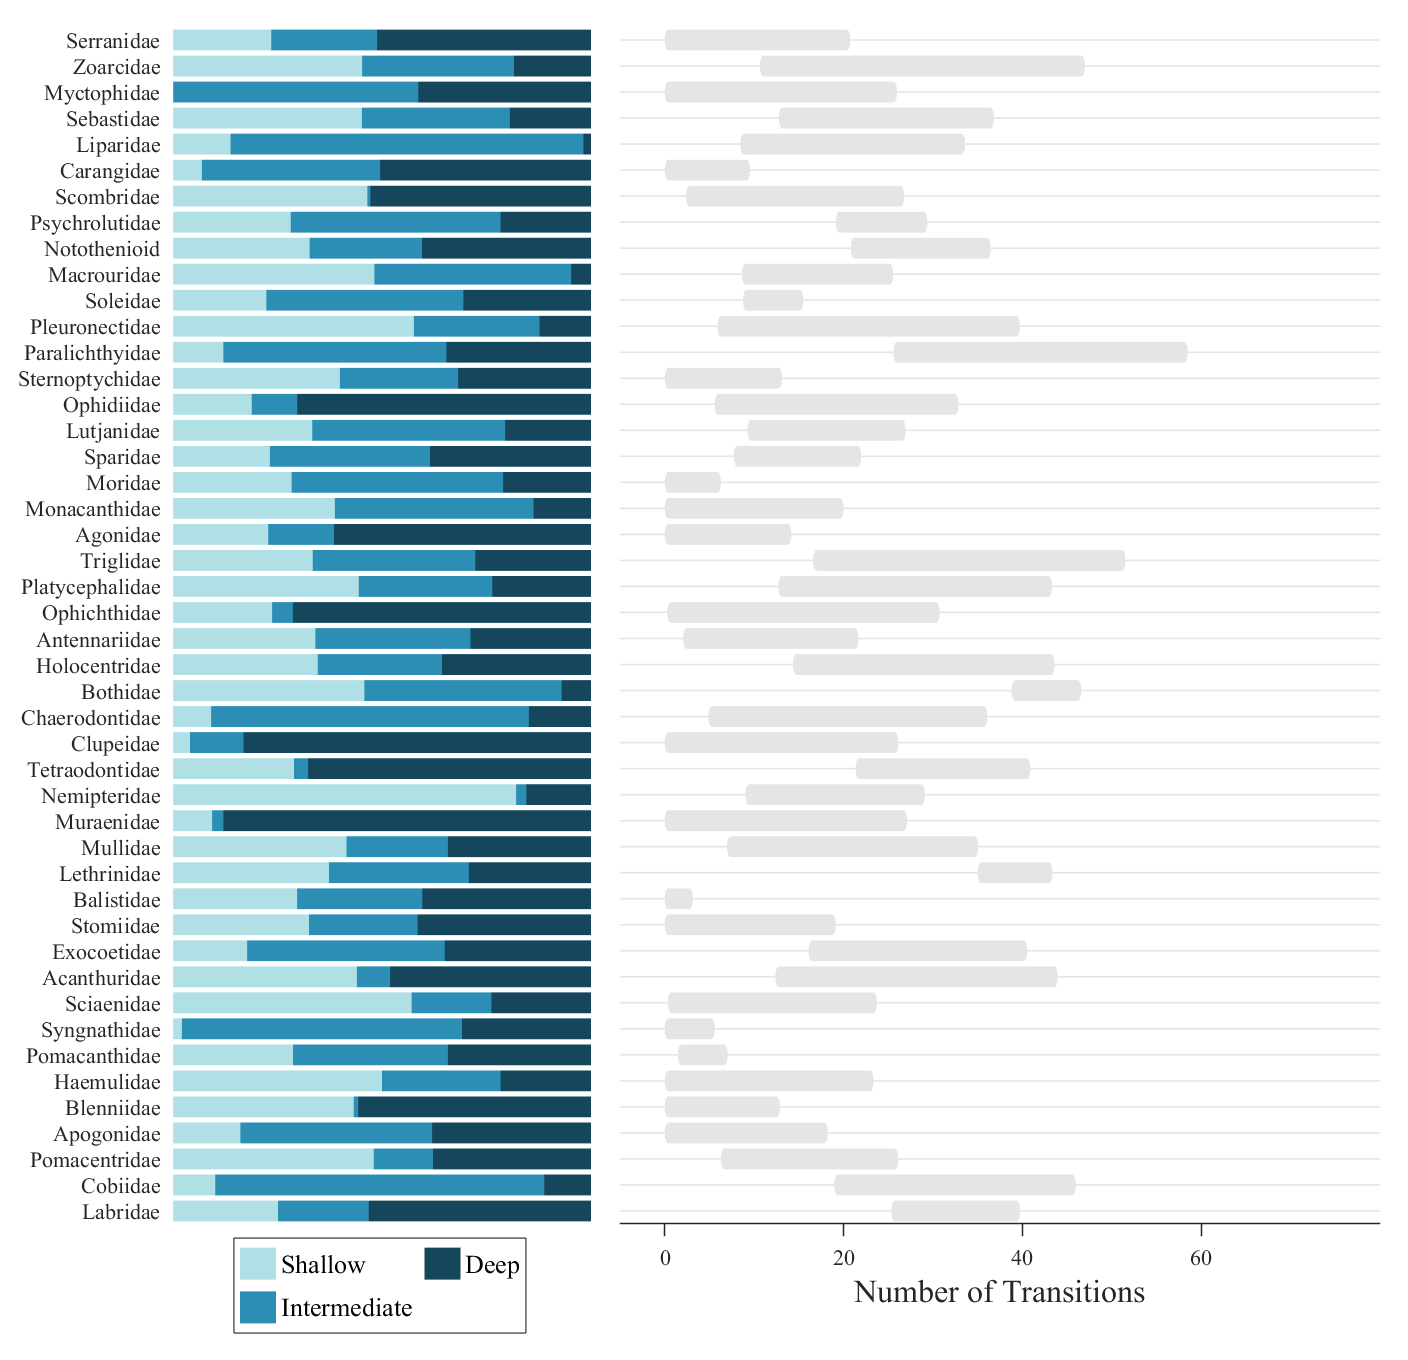
4 绘制灰线及圆角矩形
这里绘制线条其实只画了一条,只是每隔两个点之间加个NaN把线断开了:
% 绘制灰色线条
XX=repmat(ax2.XLim,[N,1])*[1,0,nan;0,1,nan];
YY=repmat((1:N)',[1,3]);XX=XX';YY=YY';
plot(ax2,XX(:),YY(:),'LineWidth',.8,'Color',[229,229,229]./255)
% 绘制圆角矩形
for i=1:N
rectangle(ax2,'Position',[Data.Low(i),i-.4,Data.High(i)-Data.Low(i),.8],...'EdgeColor','none','FaceColor',[229,229,229]./255,'Curvature',1)
end
5 绘制中位数圆点
% 绘制中值点与实际值连线
NXX=[Data.Median,Data.Exact]*[1,0,nan;0,1,nan];NXX=NXX';
plot(ax2,NXX(:),YY(:),'LineWidth',.8,'Color',[102,102,102]./255,'LineWidth',1.5)
% 绘制中值处圆点
scatter(ax2,Data.Median,1:N,120,'filled','o','MarkerFaceColor',[1,1,1],...'MarkerEdgeColor',[102,102,102]./255,'LineWidth',1.5)

6 绘制确切值圆点及图例
根据是否在范围内赋予不同的颜色:
% 绘制实际值圆点
scAHdl=scatter(ax2,Data.Exact(Data.Exact>Data.High),find(Data.Exact>Data.High),...120,'filled','o','MarkerFaceColor',[0,160,138]./255,'MarkerEdgeColor',[0,160,138]./255,'LineWidth',1.5);
scWHdl=scatter(ax2,Data.Exact(Data.Exact<=Data.High&Data.Exact>=Data.Low),find(Data.Exact<=Data.High&Data.Exact>=Data.Low),...120,'filled','o','MarkerFaceColor',[102,102,102]./255,'MarkerEdgeColor',[102,102,102]./255,'LineWidth',1.5);
scBHdl=scatter(ax2,Data.Exact(Data.Exact<Data.Low),find(Data.Exact<Data.Low),...120,'filled','o','MarkerFaceColor',[241,175,1]./255,'MarkerEdgeColor',[241,175,1]./255,'LineWidth',1.5);
% 绘制图例
lgd2Hdl=legend(ax2,[scAHdl,scWHdl,scBHdl],{'Above expectation','Within expectation','Below expectation'});
lgd2Hdl.Location='southeast';
lgd2Hdl.FontSize=13;
lgd2Hdl.TextColor=[.4,.4,.4];

完整代码
% stackedBarhBarDumbbellBemo
% @author : slandarer
% gzh  : slandarer随笔% 数据导入
Data=readtable('ta_results_revisions_data.csv');
[N,~]=size(Data);
%% ========================================================================
% figure窗口及axes坐标区域创建
fig=figure('Units','normalized','Position',[.1,.05,.55,.85],'Color',[1,1,1]);
% -------------------------------------------------------------------------
% 左侧柱状图axes
ax1=axes(fig);
ax1.NextPlot='add';
ax1.Position=[.12,.1,.3,.88];
ax1.XLim=[-.01,1];
ax1.YLim=[.5,N+.5];
plot(ax1,[-.01,-.01],[.5,N+.5],'Color',[1,1,1],'LineWidth',2)
ax1.YTick=1:N;
ax1.TickLength=[1e-5,14-5];
ax1.YTickLabel=Data.Name;
ax1.YDir='reverse';
ax1.XColor='none';
ax1.FontName='Times New Roman';
ax1.FontSize=11;
% -------------------------------------------------------------------------
ax2=axes(fig);
ax2.NextPlot='add';
ax2.Position=[.44,.1,.54,.88];
ax2.FontName='Times New Roman';
ax2.YColor='none';
ax2.XLim=[-5,80];
ax2.YLim=[.5,N+.5];
ax2.XTick=[0,20,40,60];
ax2.LineWidth=.8;
ax2.TickDir='out';
ax2.FontSize=11;
ax2.XLabel.String='Number of Transitions';
ax2.XLabel.FontSize=16;
%% ========================================================================
% 左侧堆叠柱状图绘制
barhHdl=barh(ax1,[Data.Shallow,Data.Intermediate,Data.Deep],'stacked');
% 修改配色
barhHdl(1).EdgeColor='none';
barhHdl(2).EdgeColor='none';
barhHdl(3).EdgeColor='none';
barhHdl(1).FaceColor=[176,224,230]./255;
barhHdl(2).FaceColor=[44,142,181]./255;
barhHdl(3).FaceColor=[22,70,91]./255;
% 绘制图例
lgd1Hdl=legend(ax1,barhHdl,{'Shallow','Intermediate','Deep'});
lgd1Hdl.NumColumns=2;
lgd1Hdl.ItemTokenSize=[18,18];
lgd1Hdl.Position=[.17,.02,.2,.07];
lgd1Hdl.FontSize=13;
%% ========================================================================
% 右侧哑铃图绘制
% 绘制灰色线条
XX=repmat(ax2.XLim,[N,1])*[1,0,nan;0,1,nan];
YY=repmat((1:N)',[1,3]);XX=XX';YY=YY';
plot(ax2,XX(:),YY(:),'LineWidth',.8,'Color',[229,229,229]./255)
% 绘制圆角矩形
for i=1:N
rectangle(ax2,'Position',[Data.Low(i),i-.4,Data.High(i)-Data.Low(i),.8],...'EdgeColor','none','FaceColor',[229,229,229]./255,'Curvature',1)
end
% 绘制中值点与实际值连线
NXX=[Data.Median,Data.Exact]*[1,0,nan;0,1,nan];NXX=NXX';
plot(ax2,NXX(:),YY(:),'LineWidth',.8,'Color',[102,102,102]./255,'LineWidth',1.5)
% 绘制中值处圆点
scatter(ax2,Data.Median,1:N,120,'filled','o','MarkerFaceColor',[1,1,1],...'MarkerEdgeColor',[102,102,102]./255,'LineWidth',1.5)
% 绘制实际值圆点
scAHdl=scatter(ax2,Data.Exact(Data.Exact>Data.High),find(Data.Exact>Data.High),...120,'filled','o','MarkerFaceColor',[0,160,138]./255,'MarkerEdgeColor',[0,160,138]./255,'LineWidth',1.5);
scWHdl=scatter(ax2,Data.Exact(Data.Exact<=Data.High&Data.Exact>=Data.Low),find(Data.Exact<=Data.High&Data.Exact>=Data.Low),...120,'filled','o','MarkerFaceColor',[102,102,102]./255,'MarkerEdgeColor',[102,102,102]./255,'LineWidth',1.5);
scBHdl=scatter(ax2,Data.Exact(Data.Exact<Data.Low),find(Data.Exact<Data.Low),...120,'filled','o','MarkerFaceColor',[241,175,1]./255,'MarkerEdgeColor',[241,175,1]./255,'LineWidth',1.5);
% 绘制图例
lgd2Hdl=legend(ax2,[scAHdl,scWHdl,scBHdl],{'Above expectation','Within expectation','Below expectation'});
lgd2Hdl.Location='southeast';
lgd2Hdl.FontSize=13;
lgd2Hdl.TextColor=[.4,.4,.4];

随便改个颜色:
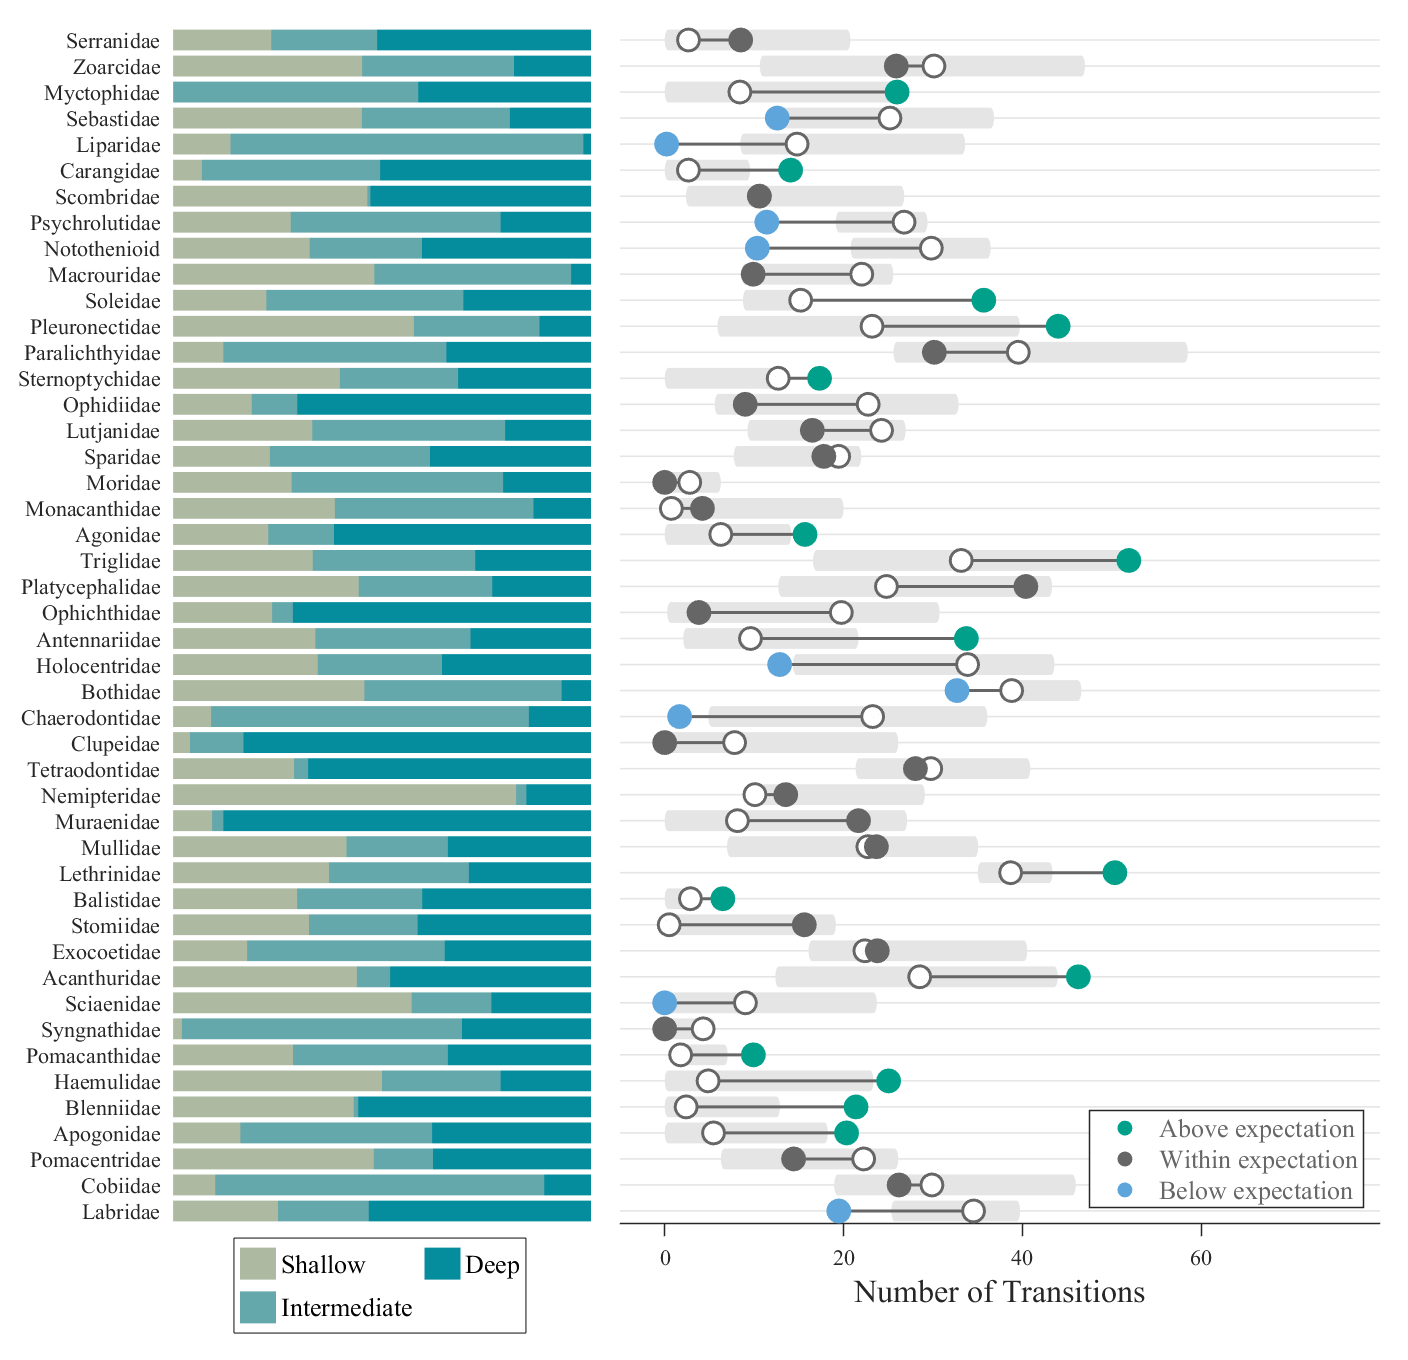
完
以上已经是完整代码,若是懒得复制可从以下gitee仓库下载文件:
https://gitee.com/slandarer/PLTreprint