编程随笔 - 包含颜色、百分比的直方图(Bar)绘制

欢迎关注我的CSDN:https://spike.blog.csdn.net/
本文地址:https://blog.csdn.net/caroline_wendy/article/details/130068335
Matplotlib的核心组件是Figure和Axes。Figure是一个容器,包含了所有的图形元素,如Axes,标题,图例等。Axes是一个子图,有自己的坐标系,可以绘制各种类型的图形,如折线图,柱状图,散点图等。一个Figure可以包含多个Axes,也可以只包含一个Axes。Matplotlib有三种主要的绘图接口:pyplot接口,面向对象接口和pylab接口。pyplot接口是一个简单的命令式风格的接口,提供了一些类似于MATLAB的函数,可以快速地创建和修改图形。面向对象接口是一个更灵活的接口,允许用户直接操作Figure和Axes对象,以及它们的属性和方法。pylab接口是一个集成了numpy和pyplot功能的接口,旨在提供一个类似于MATLAB的环境,但不推荐使用。
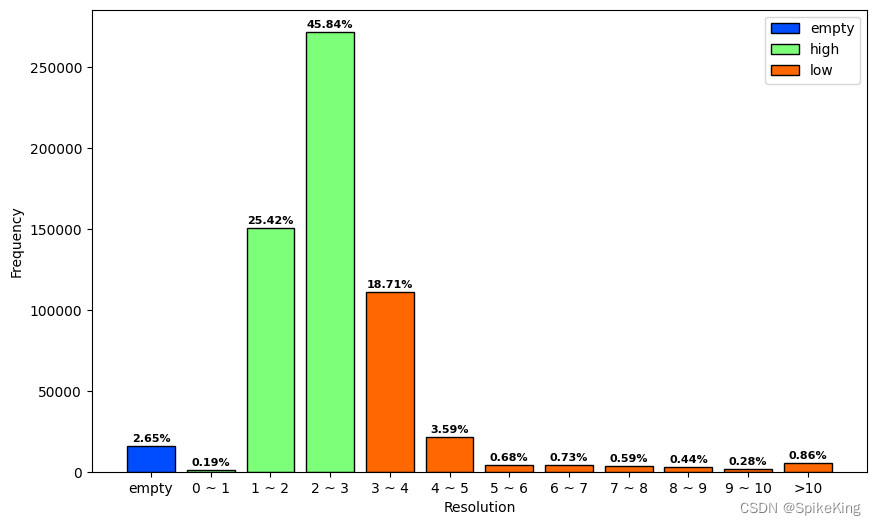
为了更好的展示数据分布,一般使用直方图的形式,即Bar,支持:
- 修改直方图bin的label;
- 修改直方图bin的颜色,以及颜色标签;
- 增加直方图bin的百分比;
- 修改图像尺寸,以及添加横纵坐标的label。
- 注意bin的label一定要是string类型,否则数字较大会导致异常!
源码如下:
@staticmethoddef draw_resolution(data_list, save_path):"""绘制分辨率,分辨率的范围是-1到10,划分11个bin其中,-1是empty、[1,2,3]是high、其余是low:param data_list: 数据列表:param save_path: 存储路径:return: 绘制图像"""labels, counts = np.unique(np.array(data_list), return_counts=True)labels_str = []for vl in labels:if vl == -1:label = "empty"else:label = f"{vl} ~ {vl+1}"labels_str.append(label)labels_str.pop(-1)labels_str.append(f">{labels[-1]}")# 颜色设置cmap = plt.get_cmap('jet')empty, high, low = cmap(0.2), cmap(0.5), cmap(0.8)color = [empty, high, high, high, low, low, low, low, low, low, low, low]graph = plt.bar(labels_str, counts, align='center', color=color, edgecolor='black')plt.gca().set_xticks(labels_str)handles = [Rectangle((0, 0), 1, 1, color=c, ec="k") for c in [empty, high, low]]color_labels = ["empty", "high", "low"]plt.legend(handles, color_labels)# 绘制百分比count_sum = sum(counts)percentage_list = []for count in counts:pct = (count / count_sum) * 100percentage_list.append(round(pct, 2))i = 0max_height = max([p.get_height() for p in graph])for p in graph:width = p.get_width()height = p.get_height()x, y = p.get_xy()plt.text(x + width / 2,y + height + max_height*0.01,str(percentage_list[i]) + '%',size=8,ha='center',weight='bold')i += 1# label设置plt.xlabel("Resolution")plt.ylabel("Frequency")# 尺寸以及存储fig = plt.gcf()fig.set_size_inches(10, 6)if save_path:plt.savefig(save_path, bbox_inches='tight', pad_inches=0.1)else:plt.show()plt.close()
效果如下:
参考:
- Stack Overfolw - Convert floats to ints in Pandas?
- Stack Overfolw - histogram: setting y-axis label for pandas
- Stack Overfolw - Matplotlib histogram with multiple legend entries
- PDB - Resolution
- Pandas: How to Combine Rows with Same Column Values
- Stack Overflow - Selecting multiple columns in a Pandas dataframe
- Stack Overflow - How to center labels in histogram plot
- Control the color of barplots built with matplotlib
- Display percentage above bar chart in Matplotlib