【python零碎】

1. 拼接字符中,插入变量
>>> shepherd = "Mary"
>>> age = 32
>>> stuff_in_string = "Shepherd {} is {} years old.".format(shepherd, age)
>>> print(stuff_in_string)
Shepherd Mary is 32 years old.
>>> 'A formatted number - {:.4f}'.format(.2)
'A formatted number - 0.2000'
>>> print("Number {:03d} is here.".format(11))
Number 011 is here.
>>> shepherd = "Martha"
>>> age = 34
>>> # Note f before first quote of string
>>> stuff_in_string = f"Shepherd {shepherd} is {age} years old."
>>> print(stuff_in_string)
Shepherd Martha is 34 years old.
>>> stuff_in_string = "Shepherd %s is %d years old." % (shepherd, age)
>>> print(stuff_in_string)
Shepherd Martha is 34 years old.
2、字符串类型的数据,转为numpy类型数组
numpy.fromstring(string, dtype=float, count=-1, *, sep, like=None)
np.fromstring('1 2', dtype=int, sep=' ')
array([1, 2])
np.fromstring('1, 2', dtype=int, sep=',')
array([1, 2])
https://numpy.org/doc/stable/reference/generated/numpy.fromstring.html
二、画图
matplotlib, xlabel,ylabel,.plot,.scatter, .legend(),plt.subplot()
matplotlib.pyplot.subplots — Matplotlib 3.1.2 documentation
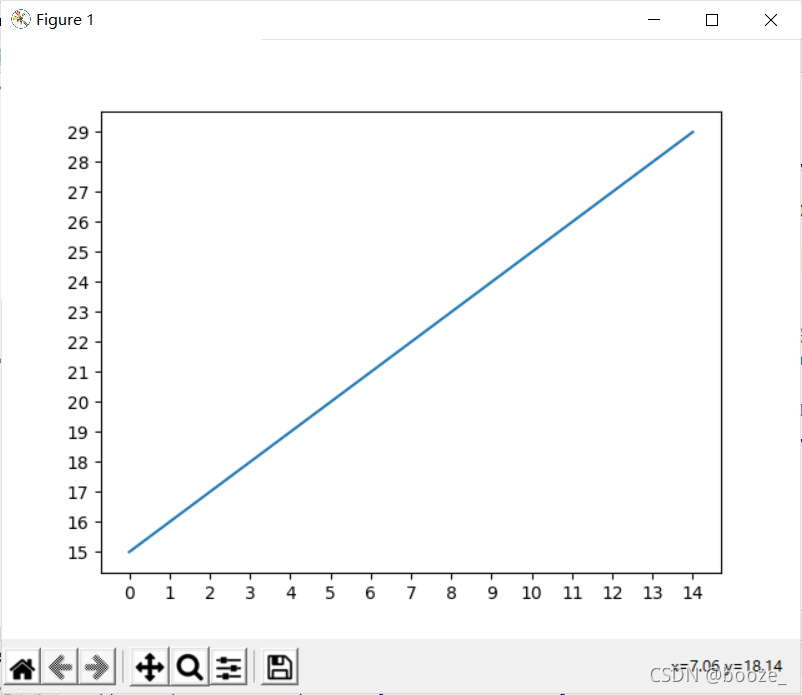
2.1\\matplotlib设置x轴刻度
# 修改x轴与y轴的刻度
import matplotlib.pyplot as plt
from pylab import xticks,yticks,np
lst1 = list(range(0,15))
lst2 = list(range(15,30))
"""
linspace()中四个参数的意义:
第一个参数为坐标的起始位置
第二个参数为坐标的终止位置
第三个参数为将坐标分成多少份(该例中将0-15分成了16份,每刻度为1)
第四个参数为是否取最后一个点(默认是endpoint=False左开右闭)
"""
# 修改横坐标的刻度
xticks(np.linspace(0,15,16,endpoint=True))
# 修改纵坐标的刻度
yticks(np.linspace(15,30,16,endpoint=True))
plt.plot(lst1,lst2)
plt.show()
import matplotlib
import numpy as np
from matplotlib import pyplot as pltmatplotlib.rcParams['font.family'] = 'SimHei'data = [{'年份': 2016, '收入': 14.5},{'年份': 2017, '收入': 15.6},{'年份': 2018, '收入': 17.9},{'年份': 2019, '收入': 23.4},{'年份': 2020, '收入': 18.6}]year = [item['年份'] for item in data]
income = [item['收入'] for item in data]plt.ylim(0, 30)     # 设置y轴刻度范围
plt.xlim(2015, 2021)
plt.yticks(np.linspace(0, 30, 11))      # 每3个单位画一个刻度值plt.plot(year, income, color='green', marker='o', linestyle='solid')
plt.title('收入情况')
plt.xlabel('年份')
plt.ylabel('万元')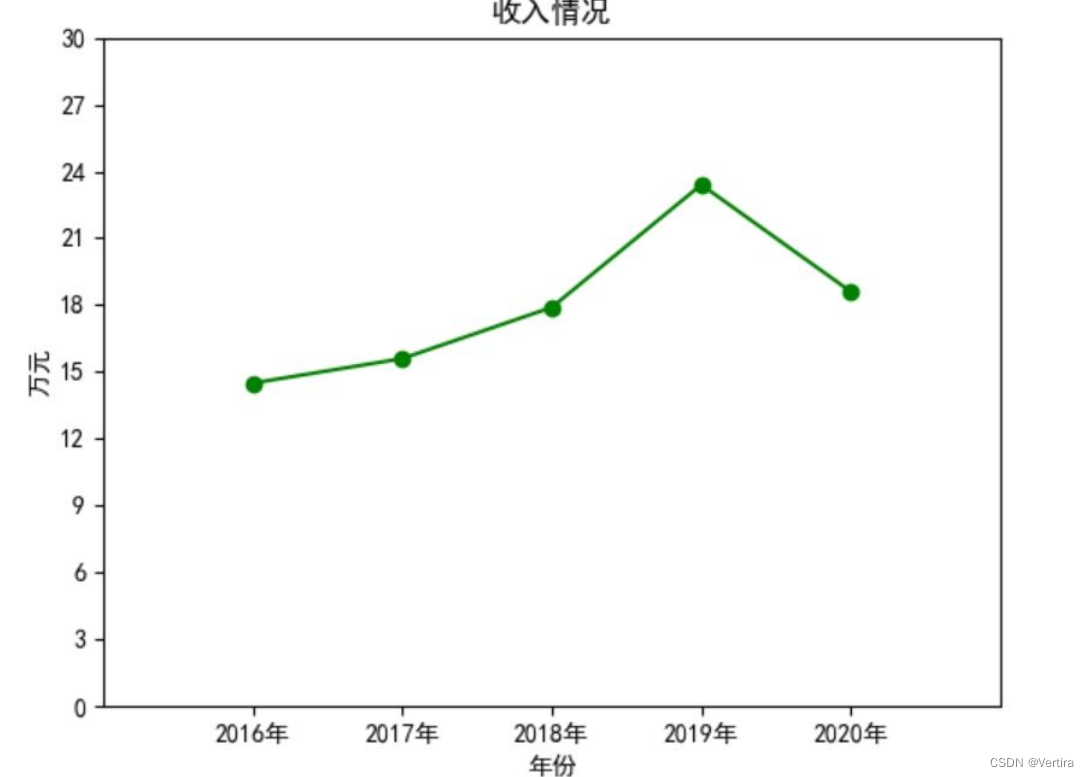
子图subplot
注意 subplot 和 subplots不一样
import matplotlib.pyplot as plt
import numpy as npx = np.linspace(1, 2, 2)
y1 = np.sin(x)y2 = np.cos(x)ax1 = plt.subplot(2, 2, 1, frameon = False) # 两行一列,位置是1的子图
plt.plot(x, y1, 'b--')
plt.ylabel('y1')
ax2 = plt.subplot(2, 2, 2, projection = 'polar')
plt.plot(x, y2, 'r--')
plt.ylabel('y2')
plt.xlabel('x')
plt.subplot(2, 2, 3, sharex = ax1, facecolor = 'red')
plt.plot(x, y2, 'r--')
plt.ylabel('y2')plt.show()
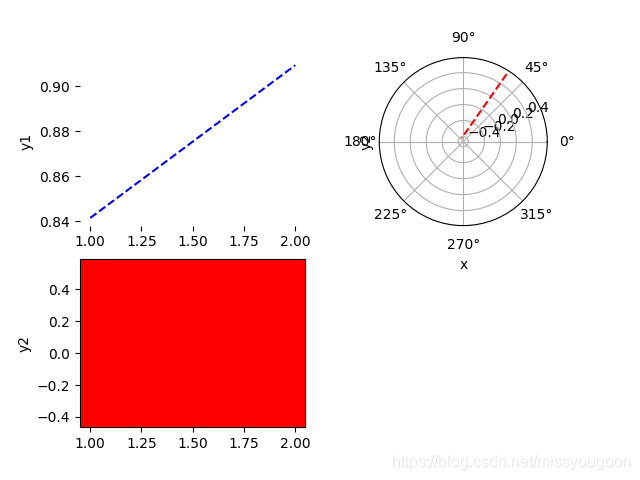
https://www.cnblogs.com/zhouzhe-blog/p/9614761.html
三、绘制图形
3.1、矢量场绘制, quiver
Quiver Simple Demo — Matplotlib 3.1.3 documentation
python matplotlib quiver——画箭头、风场_ax.quiver_liucheng_zimozigreat的博客-CSDN博客
# 修改x轴与y轴的刻度
import matplotlib.pyplot as plt
from pylab import xticks,yticks,np
lst1 = list(range(0,15))
lst2 = list(range(15,30))
"""
linspace()中四个参数的意义:
第一个参数为坐标的起始位置
第二个参数为坐标的终止位置
第三个参数为将坐标分成多少份(该例中将0-15分成了16份,每刻度为1)
第四个参数为是否取最后一个点(默认是endpoint=False左开右闭)
"""
# 修改横坐标的刻度
xticks(np.linspace(0,15,16,endpoint=True))
# 修改纵坐标的刻度
yticks(np.linspace(15,30,16,endpoint=True))
plt.plot(lst1,lst2)
plt.show()
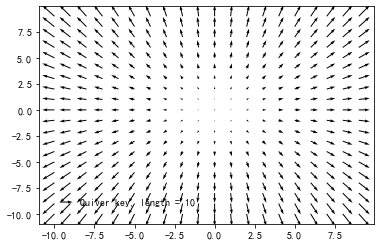
- width参数:决定箭头箭轴宽度。
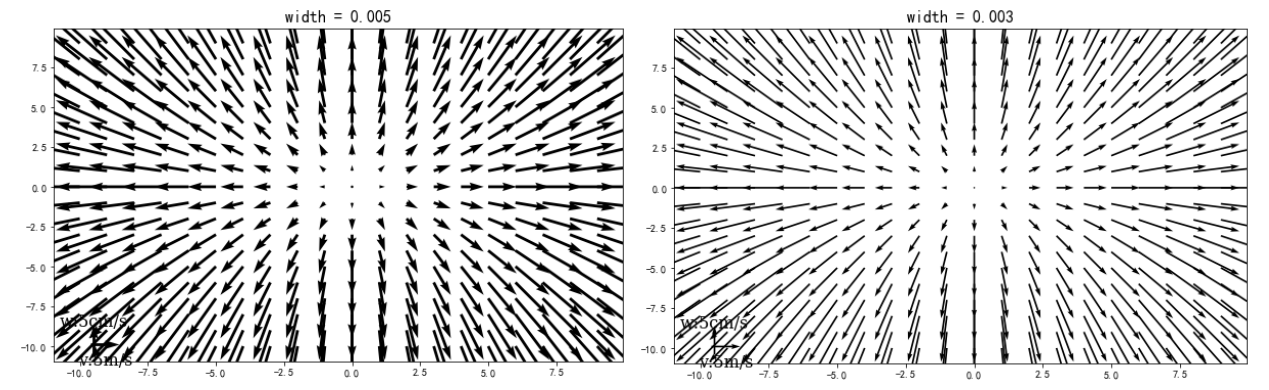
- scale参数:决定箭杆长度
![[外链图片转存失败,源站可能有防盗链机制,建议将图片保存下来直接上传(img-QU0PAT17-1583034025244)(quiver 使用介绍.assets/image-20200301003834241.png)]](https://img-blog.csdnimg.cn/20200301114256577.png)