NumPy 秘籍中文第二版:七、性能分析和调试

原文:NumPy Cookbook - Second Edition
协议:CC BY-NC-SA 4.0
译者:飞龙
在本章中,我们将介绍以下秘籍:
- 使用
timeit进行性能分析 - 使用 IPython 进行分析
- 安装
line_profiler - 使用
line_profiler分析代码 - 具有
cProfile扩展名的性能分析代码 - 使用 IPython 进行调试
- 使用
PuDB进行调试
简介
调试是从软件中查找和删除错误的行为。 分析是指构建程序的概要文件,以便收集有关内存使用或时间复杂度的信息。 分析和调试是开发人员生活中必不可少的活动。 对于复杂的软件尤其如此。 好消息是,许多工具可以为您提供帮助。 我们将回顾 NumPy 用户中流行的技术。
使用timeit进行性能分析
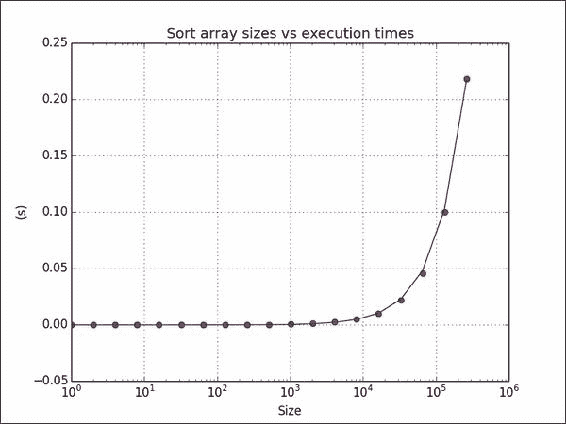
timeit是一个模块,可用于计时代码段。 它是标准 Python 库的一部分。 我们将使用几种数组大小对sort() NumPy 函数计时。 经典的快速排序和归并排序算法的平均运行时间为O(N log N),因此我们将尝试将这个模型拟合到结果。
操作步骤
我们将要求数组进行排序:
-
创建数组以排序包含随机整数值的各种大小:
times = np.array([])for size in sizes:integers = np.random.random_integers (1, 10 6, size) -
要测量时间,请创建一个计时器,为其提供执行函数,并指定相关的导入。 然后,排序 100 次以获取有关排序时间的数据:
def measure():timer = timeit.Timer('dosort()', 'from __main__ import dosort')return timer.timeit(10 2) -
通过一次乘以时间来构建测量时间数组:
times = np.append(times, measure()) -
将时间拟合为
n log n的理论模型。 由于我们将数组大小更改为 2 的幂,因此很容易:fit = np.polyfit(sizes * powersOf2, times, 1)以下是完整的计时代码:
import numpy as np
import timeit
import matplotlib.pyplot as plt# This program measures the performance of the NumPy sort function
# and plots time vs array size.
integers = []def dosort():integers.sort()def measure():timer = timeit.Timer('dosort()', 'from __main__ import dosort')return timer.timeit(10  2)powersOf2 = np.arange(0, 19)
sizes = 2  powersOf2times = np.array([])for size in sizes:integers = np.random.random_integers(1, 10  6, size)times = np.append(times, measure())fit = np.polyfit(sizes * powersOf2, times, 1)
print(fit)
plt.title("Sort array sizes vs execution times")
plt.xlabel("Size")
plt.ylabel("(s)")
plt.semilogx(sizes, times, 'ro')
plt.semilogx(sizes, np.polyval(fit, sizes * powersOf2))
plt.grid()
plt.show()
以下屏幕截图显示了运行时间与数组大小的关系图:
工作原理
我们测量了sort() NumPy 函数的平均运行时间。 此秘籍中使用了以下函数:
| 函数 | 描述 |
|---|---|
random_integers() |
给定值和数组大小的范围时,此函数创建一个随机整数数组 |
append() |
此函数将值附加到 NumPy 数组 |
polyfit() |
此函数将数据拟合为给定阶数的多项式 |
polyval() |
此函数计算多项式,并为给定的 x值返回相应的值 |
semilogx() |
此函数使用对数刻度在 X 轴上绘制数据 |
另见
timeit的文档
使用 IPython 进行分析
在 IPython 中,我们可以使用timeit来分析代码的小片段。 我们可以也分析较大的脚本。 我们将展示两种方法。
操作步骤
首先,我们将介绍一个小片段:
-
以
pylab模式启动 IPython:$ ipython --pylab创建一个包含 1000 个介于 0 到 1000 之间的整数值的数组:
In [1]: a = arange(1000)测量在数组中搜索“所有问题的答案”(42)所花费的时间。 是的,所有问题的答案都是 42。如果您不相信我,请阅读这个页面:
In [2]: %timeit searchsorted(a, 42) 100000 loops, best of 3: 7.58 us per loop -
剖析以下小脚本,该小脚本可以反转包含随机值的大小可变的矩阵。 NumPy 矩阵的
.I属性(即大写I)表示该矩阵的逆:import numpy as npdef invert(n):a = np.matrix(np.random.rand(n, n))return a.Isizes = 2 np.arange(0, 12)for n in sizes:invert(n)将此代码计时如下:
In [1]: %run -t invert_matrix.pyIPython CPU timings (estimated):User   :       6.08 s.System :       0.52 s.
Wall time:      19.26 s.
然后使用
p选项对脚本进行配置:In [2]: %run -p invert_matrix.py852 function calls in 6.597 CPU secondsOrdered by: internal timencalls tottime percall cumtime percall filename:lineno(function)12 3.228 0.269 3.228 0.269 {numpy.linalg.lapack_lite.dgesv}24 2.967 0.124 2.967 0.124 {numpy.core.multiarray._fastCopyAndTranspose}12 0.156 0.013 0.156 0.013 {method 'rand' of 'mtrand.RandomState' objects}12 0.087 0.007 0.087 0.007 {method 'copy' of 'numpy.ndarray' objects}12 0.069 0.006 0.069 0.006 {method 'astype' of 'numpy.ndarray' objects}12 0.025 0.002 6.304 0.525 linalg.py:404(inv)12 0.024 0.002 6.328 0.527 defmatrix.py:808(getI)1 0.017 0.017 6.596 6.596 invert_matrix.py:1(<module>)24 0.014 0.001 0.014 0.001 {numpy.core.multiarray.zeros}12 0.009 0.001 6.580 0.548 invert_matrix.py:3(invert)12 0.000 0.000 6.264 0.522 linalg.py:244(solve)12 0.000 0.000 0.014 0.001 numeric.py:1875(identity)1 0.000 0.000 6.597 6.597 {execfile}36 0.000 0.000 0.000 0.000 defmatrix.py:279(__array_finalize__)12 0.000 0.000 2.967 0.247 linalg.py:139(_fastCopyAndTranspose)24 0.000 0.000 0.087 0.004 defmatrix.py:233(__new__)12 0.000 0.000 0.000 0.000 linalg.py:99(_commonType)24 0.000 0.000 0.000 0.000 {method '__array_prepare__' of 'numpy.ndarray' objects}36 0.000 0.000 0.000 0.000 linalg.py:66(_makearray)36 0.000 0.000 0.000 0.000 {numpy.core.multiarray.array}12 0.000 0.000 0.000 0.000 {method 'view' of 'numpy.ndarray' objects}12 0.000 0.000 0.000 0.000 linalg.py:127(_to_native_byte_order)1 0.000 0.000 6.597 6.597 interactiveshell.py:2270(safe_execfile)
工作原理
我们通过分析器运行了上述 NumPy 代码。 下表概述了分析器的输出:
| 函数 | 描述 |
|---|---|
ncalls |
这是调用次数 |
tottime |
这是一个函数花费的总时间 |
percall |
这是每次通话所花费的时间 ,计算方法是将总时间除以通话次数 |
cumtime |
这是在函数和由函数调用的函数(包括递归调用)上花费的累积时间 |
另见
- IPython 魔术文档
安装line_profiler
line_profiler由 NumPy 的开发人员之一创建。 此模块对 Python 代码进行逐行分析。 我们将在此秘籍中描述必要的安装步骤。
准备
您可能需要安装setuptools。 先前的秘籍中对此进行了介绍; 如有必要,请参阅“另见”部分。 为了安装开发版本,您将需要 Git。 安装 Git 超出了本书的范围。
操作步骤
选择适合您的安装选项:
-
使用以下任一命令将
line_profiler与easy_install一起安装:$ easy_install line_profiler $ pip install line_profiler -
安装开发版本。
使用 Git 查看源代码:
$ git clone https://github.com/rkern/line_profiler签出源代码后,按如下所示构建它:
$ python setup.py install
另见
- 第 1 章,“使用 IPython”中的“安装 IPython”
使用line_profiler分析代码
现在我们已经安装完毕,可以开始分析。
操作步骤
显然,我们将需要代码来分析:
-
编写以下代码,以自身乘以大小可变的随机矩阵。 此外,线程将休眠几秒钟。 使用
@profile注解函数以进行概要分析:import numpy as np import time@profile def multiply(n):A = np.random.rand(n, n)time.sleep(np.random.randint(0, 2))return np.matrix(A) 2for n in 2 np.arange(0, 10):multiply(n) -
使用以下命令运行事件分析器:
$ kernprof.py -l -v mat_mult.py
Wrote profile results to mat_mult.py.lprof
Timer unit: 1e-06 sFile: mat_mult.py
Function: multiply at line 4
Total time: 3.19654 sLine #      Hits         Time  Per Hit   % Time  Line Contents
==============================================================4                                           @profile5                                           def multiply(n):6        10        13461   1346.1      0.4     A = numpy.random.rand(n, n)7        10      3000689 300068.9     93.9     time.sleep(numpy.random.randint(0, 2))8        10       182386  18238.6      5.7     return numpy.matrix(A)  2
工作原理
@profile装饰器告诉line_profiler要分析哪些函数。 下表说明了分析器的输出:
| 函数 | 描述 |
|---|---|
Line # |
文件中的行号 |
Hits |
执行该行的次数 |
Time |
执行该行所花费的时间 |
Per Hit |
执行该行所花费的平均时间 |
% Time |
执行该行所花费的时间相对于执行所有行所花费的时间的百分比 |
Line Contents |
该行的内容 |
另见
- Github
line_profiler项目页面
cProfile扩展和代码性能分析
cProfile是 Python 2.5 中引入的C扩展名。 它可以用于确定性分析。 确定性分析表示所获得的时间测量是精确的,并且不使用采样。 这与统计分析相反,统计分析来自随机样本。 我们将使用cProfile对一个小的 NumPy 程序进行分析,该程序会对具有随机值的数组进行转置。
操作步骤
同样,我们需要代码来配置:
-
编写以下
transpose()函数以创建具有随机值的数组并将其转置:def transpose(n):random_values = np.random.random((n, n))return random_values.T -
运行分析器,并为其提供待分析函数:
cProfile.run('transpose (1000)')可以在以下片段中找到本教程的完整代码:
import numpy as np
import cProfiledef transpose(n):random_values = np.random.random((n, n))return random_values.TcProfile.run('transpose (1000)')
对于
1000 x 1000的数组,我们得到以下输出:4 function calls in 0.029 CPU secondsOrdered by: standard namencalls tottime percall cumtime percall filename:lineno(function)1 0.001 0.001 0.029 0.029 <string>:1(<module>)1 0.000 0.000 0.028 0.028 cprofile_transpose.py:5(transpose)1 0.000 0.000 0.000 0.000 {method 'disable' of '_lsprof.Profiler' objects}1 0.028 0.028 0.028 0.028 {method 'random_sample' of 'mtrand.RandomState' objects}输出中的列与 IPython 分析秘籍中看到的列相同。
另见
- Python 分析器文档
- 与
pstats一起工作的教程
使用 IPython 进行调试
“如果调试是清除软件错误的过程,则编程必须是放入它们的过程。”
– 荷兰计算机科学家 Edsger Dijkstra,1972 年图灵奖的获得者
调试是没人真正喜欢,但是掌握这些东西非常重要的东西之一。 这可能需要几个小时,并且由于墨菲定律,您很可能没有时间。 因此,重要的是要系统地了解您的工具。 找到错误并实现修复后,您应该进行单元测试(如果该错误具有来自问题跟踪程序的相关 ID,我通常在末尾附加 ID 来命名测试)。 这样,您至少不必再次进行调试。 下一章将介绍单元测试。 我们将调试以下错误代码。 它尝试访问不存在的数组元素:
import numpy as npa = np.arange(7)
print(a[8])
IPython 调试器充当普通的 Python pdb调试器; 它添加了选项卡补全和语法突出显示等功能。
操作步骤
以下步骤说明了典型的调试会话:
-
启动 IPython Shell。 通过发出以下命令在 IPython 中运行错误脚本:
In [1]: %run buggy.py --------------------------------------------------------------------------- IndexError Traceback (most recent call last) .../site-packages/IPython/utils/py3compat.pyc in execfile(fname, *where)173 else:174 filename = fname --> 175 __builtin__.execfile(filename, *where).../buggy.py in <module>()23 a = numpy.arange(7) ----> 4 print a[8]IndexError: index out of bounds -
现在您的程序崩溃了,启动调试器。 在发生错误的行上设置一个断点:
In [2]: %debug > .../buggy.py(4)<module>()2 3 a = numpy.arange(7) ----> 4 print a[8] -
使用
list命令列出代码,或使用简写l:ipdb> list1 import numpy as np2 3 a = np.arange(7) ----> 4 print(a[8]) -
现在,我们可以在调试器当前所在的行上求值任意代码:
ipdb> len(a) 7ipdb> print(a) [0 1 2 3 4 5 6] -
调用栈是包含有关正在运行的程序的活动函数的信息的栈。 使用
bt命令查看调用栈:ipdb> bt.../py3compat.py(175)execfile()171 if isinstance(fname, unicode):172 filename = fname.encode(sys.getfilesystemencoding())173 else:174 filename = fname --> 175 __builtin__.execfile(filename, *where)> .../buggy.py(4)<module>()0 print a[8]向上移动调用栈:
ipdb> u
> .../site-packages/IPython/utils/py3compat.py(175)execfile()173             else:174                 filename = fname
--> 175             __builtin__.execfile(filename, *where)
下移调用栈:
ipdb> d
> .../buggy.py(4)<module>()23 a = np.arange(7)
----> 4 print(a[8])
工作原理
在本教程中,您学习了如何使用 IPython 调试 NumPy 程序。 我们设置一个断点并导航调用栈。 使用了以下调试器命令:
| 函数 | 描述 |
|---|---|
list或 l |
列出源代码 |
bt |
显示调用栈 |
u |
向上移动调用栈 |
d |
下移调用栈 |
另见
- Python 调试器文档
ipdb包的主页
使用 PuDB 进行调试
PuDB 是基于视觉的,全屏,基于控制台的 Python 调试器,易于安装。 PuDB 支持光标键和 vi 命令。 如果需要,我们还可以将此调试器与 IPython 集成。
操作步骤
我们将从安装pudb开始:
-
要安装
pudb,我们只需执行以下命令(或等效的pip命令):$ sudo easy_install pudb $ pip install pudb $ pip freeze|grep pudb pudb==2014.1 -
让我们调试前面示例中的
buggy程序。 如下所示启动调试器:$ python -m pudb buggy.py以下屏幕截图显示了调试器的用户界面:
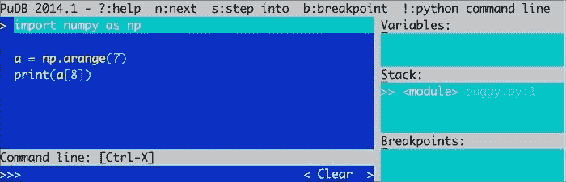
屏幕快照在顶部显示了最重要的调试命令。 我们还可以看到正在调试的代码,变量,栈和定义的断点。 键入q退出大多数菜单。 键入n将调试器移至下一行。 我们还可以使用光标键或 vi 的j和k键移动,例如,通过键入b设置断点。
另见
- PyPi PuDB 页面