matplotlib 笔记:subplot之间间距拉开

0 前情介绍
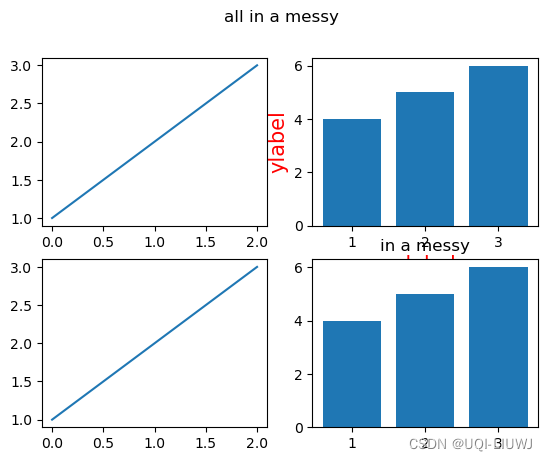
使用matplotlib的subplot时,由于默认间距不大,所以可能导致出的图会挤在一起
import matplotlib.pyplot as pltplt.subplot(221)
plt.plot([1, 2, 3])plt.subplot(222)
plt.bar([1, 2, 3], [4, 5, 6])plt.xlabel('xlabel', fontsize=15, color='r')
plt.ylabel('ylabel', fontsize=15, color='r')plt.subplot(223)
plt.plot([1, 2, 3])plt.subplot(224)
plt.bar([1, 2, 3], [4, 5, 6])
plt.title('in a messy')
#单个子图的titleplt.suptitle('all in a messy')
#整张图的title
plt.show();
1 subplots_adjust
改进方法是使用subplots_adjust
1.1 参数说明
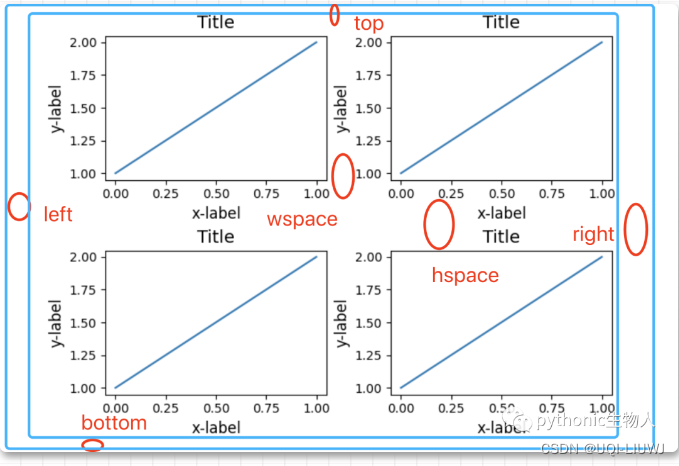
subplots_adjust有6个参数
| left | 子图左边缘的位置,以图形宽度的分数表示。 |
| right | 子图右边缘的位置,以图形宽度的分数表示。 |
| bottom | 子图底边缘的位置,以图形高度的分数表示。 |
| top | 子图顶边缘的位置,以图形高度的分数表示。 |
|
wspace |
子图之间的填充宽度,以平均轴宽度的分数表示。 |
| hspace | 子图之间的填充高度,以平均轴高度的分数表示。 |
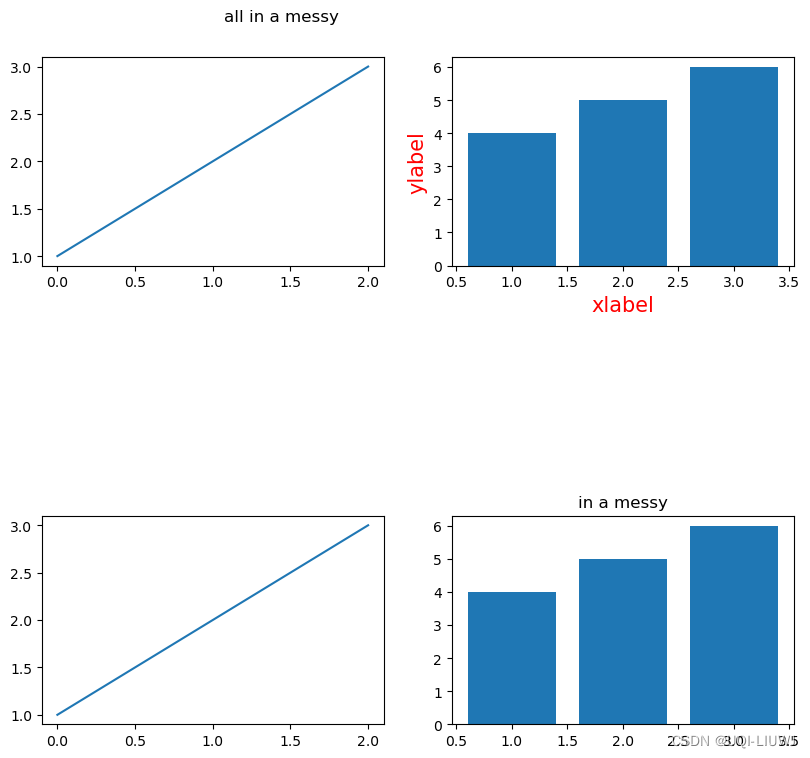
1.2 举例
import matplotlib.pyplot as pltplt.subplot(221)
plt.plot([1, 2, 3])plt.subplot(222)
plt.bar([1, 2, 3], [4, 5, 6])plt.xlabel('xlabel', fontsize=15, color='r')
plt.ylabel('ylabel', fontsize=15, color='r')plt.subplot(223)
plt.plot([1, 2, 3])plt.subplot(224)
plt.bar([1, 2, 3], [4, 5, 6])
plt.title('in a messy')
#单个子图的titleplt.suptitle('all in a messy')
#整张图的titleplt.subplots_adjust(left=0.125,bottom=-0.51,right=1.3,top=0.88,wspace=0.2,hspace=1.2)plt.show();
参考内容:图太多,挤在一起了,哦多开? (qq.com)