python采集《保你*平安》评论数据并作可视化分析

前言
大家早好、午好、晚好吖 ❤ ~欢迎光临本文章

“当你张嘴说一个人是‘小姐’的时候,不管是不是,她都已经是了。”
这句台词源于《保你*平安》,不知道大家有没有看过这个呢?

很多看过点映的人,都是一致好评,但真的好看吗?
不妨我们用Python,把提前点映看过的观众的评论获取下来,分析分析
更多python资料、源码、教程皆可点击文章下方名片获取此处跳转
开发环境
-
python 3.8 运行代码
-
pycharm 2022.3 辅助敲代码
实现代码的基本思路:
数据来源分析:
-
明确需求:
-
采集的网站是什么?
-
采集的数据是什么?
评论相关数据
-
-
抓包分析相关数据来源
通过浏览器自带开发者工具进行抓包分析 <重点>
-
打开开发者工具: F12 或者 鼠标右键点击检查选择network
-
刷新网页: 让本网页的数据内容重新加载一遍
-
关键字搜索: 通过关键字<要的数据>, 搜索查询相对应的数据包
-
-
利用获取的数据进行可视化分析
数据获取代码展示
请求链接
url = f'*/subject/35457272/comments?start=20&limit=20&status=P&sort=new_score'
伪装模拟
headers = {# User-Agent 用户代理, 表示浏览器基本身份标识'User-Agent': 'Mozilla/5.0 (Windows NT 10.0; WOW64) AppleWebKit/537.36 (KHTML, like Gecko) Chrome/101.0.0.0 Safari/537.36'
}
发送请求
response = requests.get(url=url, headers=headers)
# <Response [200]>
print(response)
把获取下来html字符串数据 <response.text>, 转成可解析对象
# <Selector xpath=None data='<html lang="zh-CN" class="ua-windows ...'>
selector = parsel.Selector(response.text) # ---> 你现金是美元, 没办法在中国使用 <先去银行兑换RMB>
第一次提取, 所有div标签
divs = selector.css('div.comment-item')
for循环遍历, 把列表里面元素一个一个提取出来
for div in divs:name = div.css('.comment-info a::text').get() # 昵称rating = div.css('.rating::attr(title)').get() # 推荐date = div.css('.comment-time::attr(title)').get() # 时间area = div.css('.comment-location::text').get() # 地区votes = div.css('.votes::text').get() # 有用short = div.css('.short::text').get().replace('\\n', '') # 评论
数据存字典里面
dit = {'昵称': name,'推荐': rating,'时间': date,'地区': area,'有用': votes,'评论': short,}
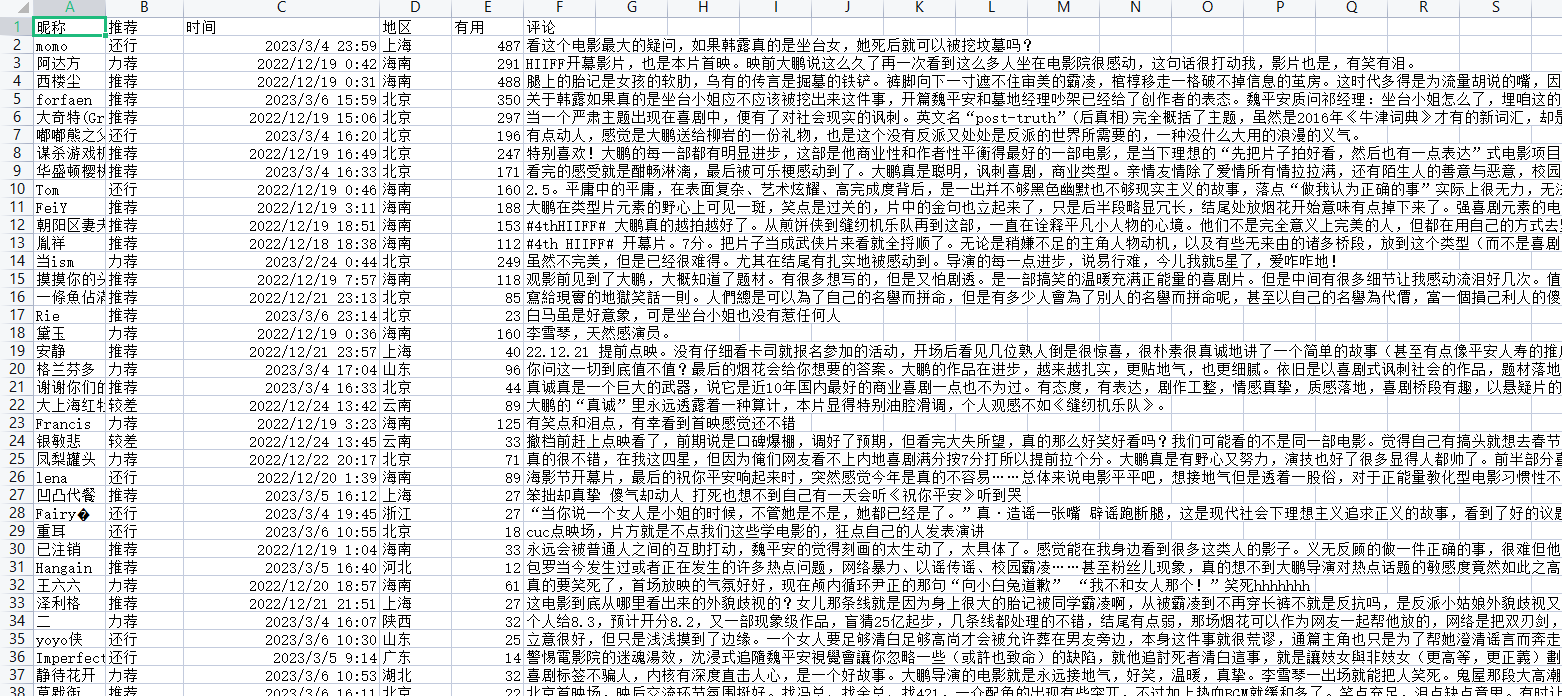
保存数据
f = open('保你/平安.csv', mode='a', encoding='utf-8-sig', newline='')
csv_writer = csv.DictWriter(f, fieldnames=['昵称','推荐','时间','地区','有用','评论',
])
csv_writer.writeheader()
可视化展示
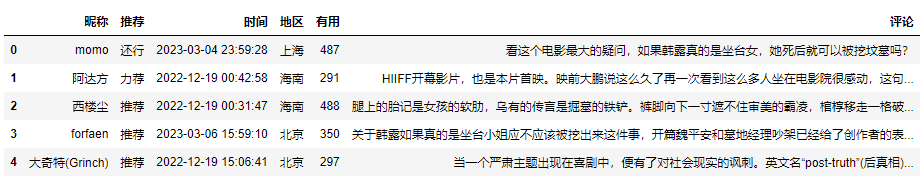
读取相关数据
df = pd.read_csv('保你平安.csv')
df.head()
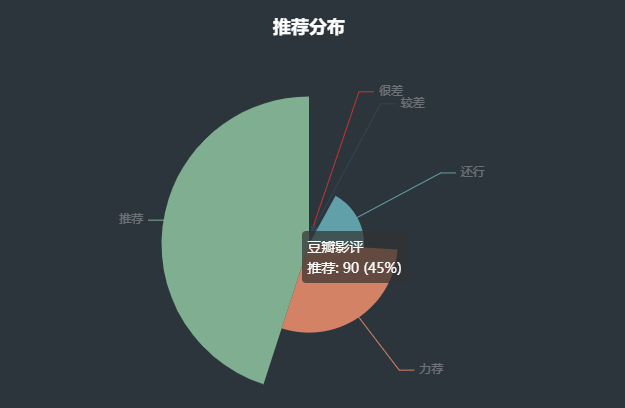
推荐分布
import pyecharts.options as opts
from pyecharts.charts import Piedata_pair = [list(z) for z in zip(evaluate_type, evaluate_num)]
data_pair.sort(key=lambda x: x[1])c = (Pie(init_opts=opts.InitOpts(bg_color="#2c343c")).add(series_name="豆瓣影评",data_pair=data_pair,rosetype="radius",radius="55%",center=["50%", "50%"],label_opts=opts.LabelOpts(is_show=False, position="center"),).set_global_opts(title_opts=opts.TitleOpts(title="推荐分布",pos_left="center",pos_top="20",title_textstyle_opts=opts.TextStyleOpts(color="#fff"),),legend_opts=opts.LegendOpts(is_show=False),).set_series_opts(tooltip_opts=opts.TooltipOpts(trigger="item", formatter="{a} <br/>{b}: {c} ({d}%)"),label_opts=opts.LabelOpts(color="rgba(255, 255, 255, 0.3)"),)
)
c.render_notebook()
地区分布
import pyecharts.options as opts
from pyecharts.charts import Piedata_pair = [list(z) for z in zip(area_type, area_num)]
data_pair.sort(key=lambda x: x[1])d = (Pie(init_opts=opts.InitOpts(bg_color="#2c343c")).add(series_name="豆瓣影评",data_pair=data_pair,rosetype="radius",radius="55%",center=["50%", "50%"],label_opts=opts.LabelOpts(is_show=False, position="center"),).set_global_opts(title_opts=opts.TitleOpts(title="地区分布",pos_left="center",pos_top="20",title_textstyle_opts=opts.TextStyleOpts(color="#fff"),),legend_opts=opts.LegendOpts(is_show=False),).set_series_opts(tooltip_opts=opts.TooltipOpts(trigger="item", formatter="{a} <br/>{b}: {c} ({d}%)"),label_opts=opts.LabelOpts(color="rgba(255, 255, 255, 0.3)"),)
)
d.render_notebook()
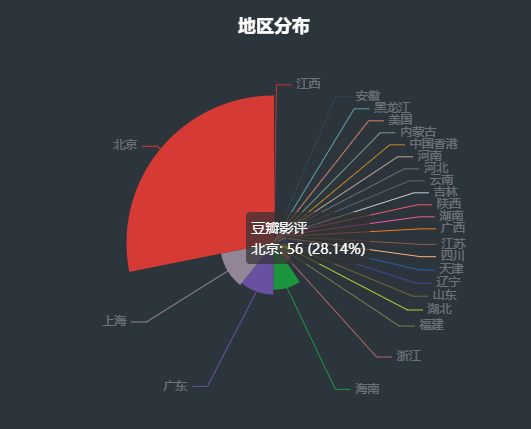
这样分析下来,好像还不错呀,应该是值得一看的
尾语 💝
好了,今天的分享就差不多到这里了!
完整代码、更多资源、疑惑解答直接点击下方名片自取即可。
对下一篇大家想看什么,可在评论区留言哦!看到我会更新哒(ง •_•)ง
喜欢就关注一下博主,或点赞收藏评论一下我的文章叭!!!

最后,宣传一下呀~👇👇👇更多源码、资料、素材、解答、交流皆点击下方名片获取呀👇👇👇