vue-piechart-饼形图

vue代码
<template>
<div :class="className" :style="{height:height,width:width}" />
</template>
<script>
import echarts from 'echarts'
require('echarts/theme/macarons') // echarts theme
import resize from './mixins/resize'
//自己写的js代码,访问后端接口
import { homeUserDeviceChart } from "@/api/home";
export default {
mixins: [resize],
props: {
className: {
type: String,
default: 'chart'
},
width: {
type: String,
default: '100%'
},
height: {
type: String,
default: '300px'
}
},
data() {
return {
chart: null,
resultData : [],
legendData : []
}
},
created() {
this.getList()
},
mounted() {
this.$nextTick(() => {
this.initChart()
})
},
beforeDestroy() {
if (!this.chart) {
return
}
this.chart.dispose()
this.chart = null
},
methods: {
getList() {
homeUserDeviceChart().then(response => {
for(let i = 0;i < response.data.length;i++){
//分类名称
this.legendData.push(response.data[i].x);
}
//占比值 name-名称 value-数值
this.resultData =response.data.map(item => {
return {
name: item.x,
value: item.y
};
})
this.initChart();
}
);
},
initChart() {
this.chart = echarts.init(this.$el, 'macarons')
this.chart.setOption({
tooltip: {
trigger: 'item',
formatter: '{a} <br/>{b} : {c} ({d}%)'
},
legend: {
left: 'center',
bottom: '10',
data: this.legendData
},
series: [
{
name: '运动分类占比',
type: 'pie',
roseType: 'radius',
radius: [15, 95],
center: ['50%', '38%'],
data:this.resultData,
animationEasing: 'cubicInOut',
animationDuration: 2600
}
]
})
}
}
}
</script>
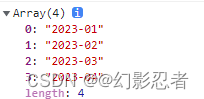
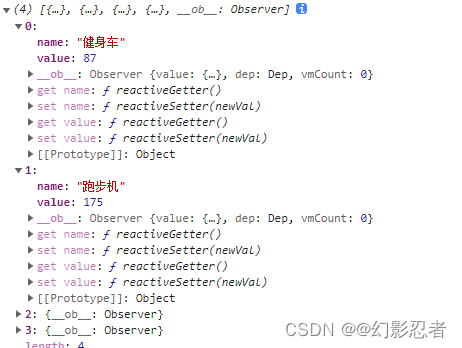
数组格式
legendData值格式:
resultData饼形图展示占比格式:
js代码
/
* 首页
* 会员变化趋势
* @param {*} query
* @returns
*/
export function homeUserNumGroupMonthChart(query) {
return request({
url: '/funs/home/getHomeUserNumGroupMonthChart',
method: 'get',
params: query
})
}